Resistance Level
Resistance Level
The resistance level can visualize using different technical indicators rather than simply drawing a line connecting highs.
What is Resistance?
Initially, the resistance level on a candlestick chart is the price when you can expect more sellers than buyers. It prevents the price from rising further and the resistance levels indicate a price point on the chart when traders expect a maximum supply, in selling terms, for a particular stock.
Always above the current market price, resistance often acts as an indicator to sell. The resistance level is one of the key metrics on which market participants have a keen eye in a rising market. To put it simply, support and resistance are opposite to each other.
Example
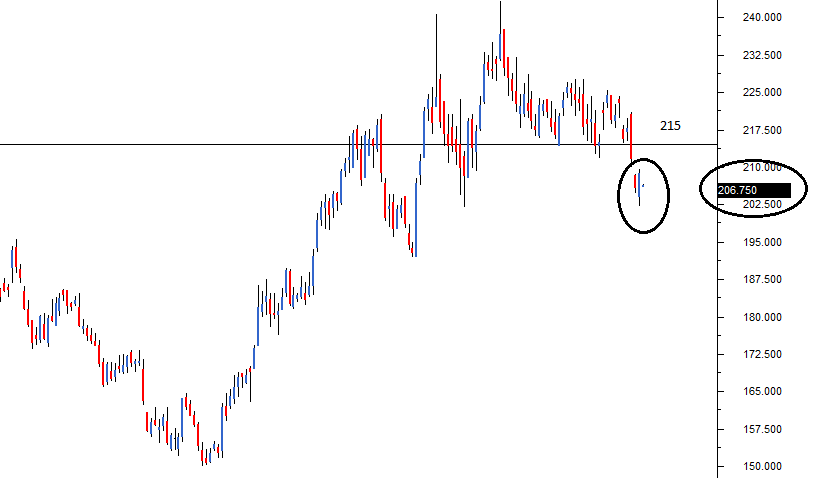
As the name suggests, resistance is something that stops the price from rising further. The resistance level is a price point on the chart where traders expect maximum supply for the stock/index. The resistance level is always above the current market price.
The likelihood of the price rising to the resistance level, consolidating, absorbing all the supply, and declining is high. Therefore, resistance is one of the critical technical analysis tools which market participants look at in a rising market. The resistance often acts as a trigger to sell.
Let’s say you have a long position on shares from company ABC, which are currently trading at $50. Previous upward momentum has met a level at $55, so you have decided that the next time the market rises to $55 you will take your profit from the rise.
Therefore, the market rises again, so you close your position and a lot of market participants also decide to sell their shares, driving the market down. After it, the sell-off means that the asset has reached a level at $55, and will retreat again.
If the market did breakthrough, it would be likely to rally on the back of the increased market confidence and $55 would become the new support level at which buyers enter the market.