Support Level
Support Level
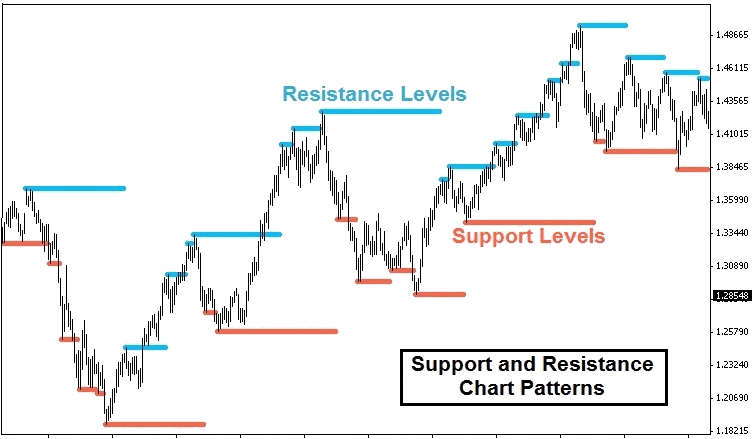
Support level occurs where a downtrend expects to pause due to a concentration of demand.
It refers to the price level that an asset does not fall below for a period of time. Buyers, entering the market whenever the asset dips to a lower price, create an asset’s support level. In technical analysis, the simple support level can be charted by drawing a line along with the lowest lows for the time period being considered. The support line can be flat or slanted up or down with the overall price trend. Other technical indicators and charting techniques can be used to identify more advanced versions of support.
Identifying support
Horizontal resistance
There are generally two types of support: horizontal and diagonal. In this first example, you can see an instance of horizontal support that formed in stock at $182, as seen in Figure 1. Notice how the stock stopped going down and started moving up on four different occasions after trading to $182. These four roughly equal lows, when connected by a line, form support. A trader identifying this support might try to buy the stock near support.
Diagonal resistance
The second type of support is diagonal. Like horizontal support, diagonal support forms connecting lows. The difference with diagonal support is that the lows are sequentially higher because a stock is in an uptrend. You can see an example of diagonal support in Figure 2. Notice how the stock stopped going down and continued trending up, on several occasions after its price dropped near the diagonal support line. A trader identifying this support might try to buy the stock near support.
Trendlines
The examples above show a constant level prevents an asset’s price from moving higher or lower. This static barrier is one of the most popular forms of support/resistance, but the price of financial assets generally trends upward or downward, so it is not uncommon to see these price barriers change over time. This is why the concepts of trending and trendlines are important when learning about support and resistance.
When the market is trending to the upside, resistance levels form a slower price action and starts to move back toward the trendline. This occurs as a result of profit-taking or near-term uncertainty for a particular issue or sector. The resulting price action undergoes a “plateau” effect, or a slight drop-off in stock price, creating a short-term top.