ZMFX all pivot levels
ZMFX all pivot levels
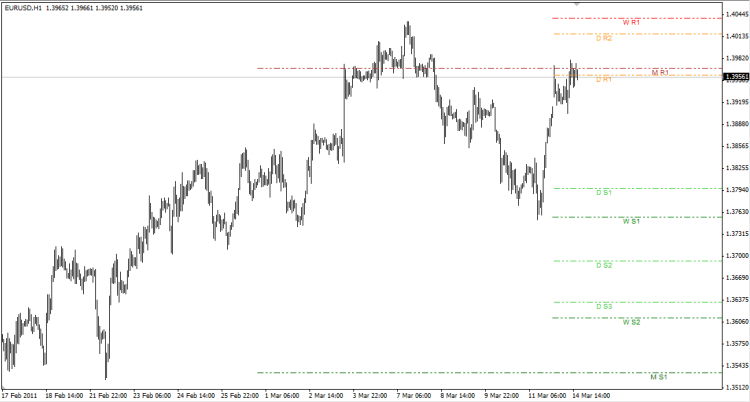
Here is an indicator, which draws daily, weekly and monthly pivots, support and resistance levels. All lines are drawn from the beginning of the timeframe (daily levels – from the beginning of the day etc.).
You will be able to choose which timeframe (monthly, weekly, daily) pivots, support and resistance levels to show. Also, there is an option to choose any level colour.