Welch Bollinger Band ® Width
Welch Bollinger Band ® Width
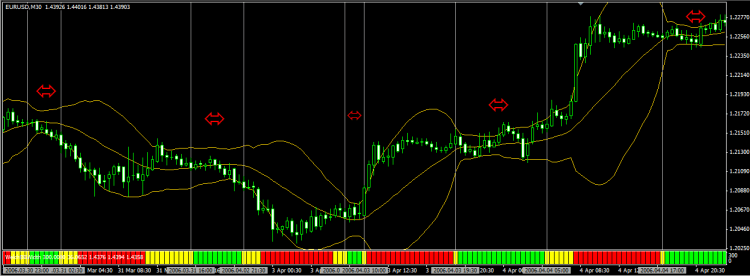
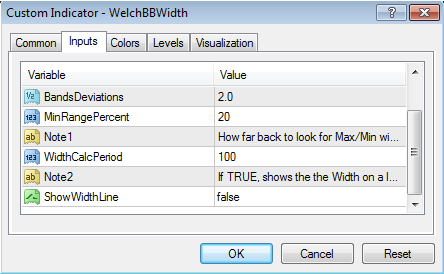
This indicator takes the current Width of the Bollinger Bands and compares it to the Maximum and Minimum Width of the Bollinger Bands over N periods (WidthCalcPeriod).
If the calculated percentage is less than or equal to MinRangePercent, then the histogram shows Green. If the calculated percentage is 2x the MinRangePercent, then the histogram shows Yellow. If neither of those match, the histogram shows Red.
This works out well to quickly see if the currency pair is ranging, or about to break out of range. If you set ShowWidthLine to true, then it will also show a line with the actual width of the Bollinger Bands in PIPS. This should work for 4 and 5 digit brokers and it works on all currency pairs.
Using iCustom to pull out values for an Expert Advisor or other Custom Indicators.
*NOTE: The dark grey vertical lines and red arrows were added to show the correlation of the indicator to the bollinger bands on the chart and they will NOT show up on your chart.