Ultra – ATR scalping tool
Ultra – ATR scalping tool
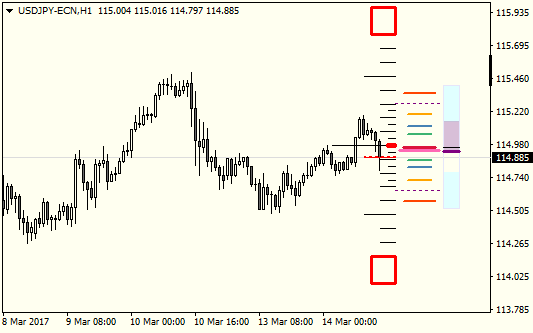
The experimental indicator I wrote for myself. It’s made to show some reference (it’s more like a rifle scope than a rifle). The main components are pip scale, ATR/pivot, MA level, RSI, and spread alert. Can be used on any timeframe, but since it’s made for scalping it is somewhat adjusted for M1-M15.
Pips Scale
Settings: Scale Zero Level Shift.
This is a simple scale. Middle (zero levels) is placed at the middle of the body of the chosen candle. This can be adjusted so that you can differentiate reversal from pullbacks.
Rule of thumb is: Trend is up when the price is above Zero Level, the trend is down when the price is below.
ATR/Pivots
Settings: Mode(Standard, Fibonacci), Period (No of M5 Bars), Lines – Style, Color, Width.
There’s some math behind this one. The weighted average of a chosen number of M5 bars (for open/close/high/low price)
The range is adjusted with ATR from this range, and all these are used to calculate pivot levels.
Because of that, these levels will be dynamic, depending on ATR value, so chosen Period makes big difference here. The lower number the more dynamic levels (they will expand and contract). For intraday trading/scalping Period 12 – 288 is reasonable (1-24 hours).
Rule of thumb just like other pivot tools.
MA Level
Settings: Period, Method, Applied price, Timeframe, Line Color/Style/Width.
This is an additional line that shows the latest price of Moving Average from a chosen time-frame. If the level is “outside” the chart the line is drawn at the top/bottom of the chart (longer and thicker). I use EMA(16) of typical price on H1, which shows the trend pretty well.
Rule of thumb: the trend is up then the price is above the MA level, the trend is down when the price is below.
RSI indicator
Settings: Period
This one may seem confusing at first. (it’s more like looking at RSI from the side, like a plan view). The line shows current RSI, color fill shows a plan view of the last n bars (min/max value) (n is the same as the RSI period).
Rule of thumb: RSI > 50 trend is up, RSI < 50 trend is down. Also when trending sideways the color fill is tight around 50.
Spread Alert
Settings: Ratio, Color.
Set the ratio of spread and ATR to trigger the alert. When it’s triggered it changes the color of the Bid/Ask line, and some scale lines to draw your attention. Enable debug mode to show some internal numbers, also spread, ATR, and %ratio to help you adjust this level.