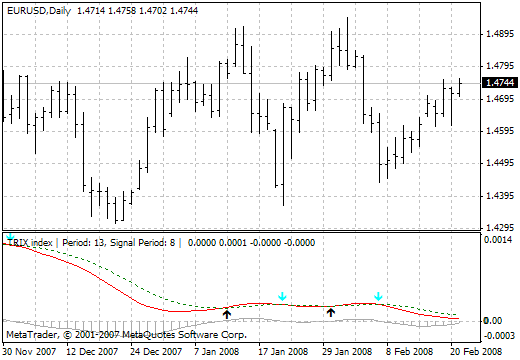
Trix
Trix
Indicator Trix is used in determining of the overbought/oversold market conditions. You can also use it as an impulse indicator. Like in other oscillators, the values of Trix range near zero. When Trix is used as an oscillator, a positive value says for the overbought market, whereas a negative values testifies the oversold market.
When Trix is used as an impulse indicator, a positive value means that the impulse is growing, whereas a negative value will testify a sinking impulse.
Many analysts suppose it to be a signal to buy, if Trix intersects zero value from top to bottom, whereas the intersection of it from bottom to top is considered as a signal to sell. If there is a divergence between the price and indicator line, this informs about a turning point in the market trend.
| Input | Type | Default value | Description |
|---|---|---|---|
| Price | Number | Close | Price type for calculations |
| Length | Number | 18 | Amount of bars for calculations |
Two main advantages of Trix as compared to other trend-following indicators is its ability to filter market noises and its quicker response to the market situation. Using the triple exponential moving average, Trix filters market noises and excludes short-term cycles that may inform about changes in movements on the market. If you use Trix as your main indicator, it would be recommended to use it together with other indicators in order to prevent following false signals.
Example: In order to assign the value of indicator TRIX to a variable for High price of 14 bars, you should use the following code: Var1 = TRIX(High,14);
