TrendLinearReg
TrendLinearReg
How a trend changes? How to determine a flat? How to trade? … etc. This indicator will help to answer these questions.
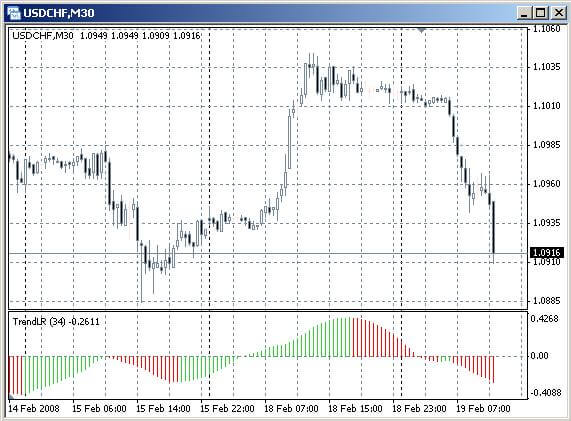
If you assume that the trend within N bars is a straight line you can calculate the parameters of that line. You know the equation of the straight line from the school, it is y = bx + с. The inclination of the line is characterized by the “b” coefficient or tangent of the angle of slope. The indicator calculates this parameter using the linear regression on every bar and display it in a separate window. If the color is green it means that the value is greater than the previous one, i.e. the angle of slope increases, the red color means the opposite.
In sober fact, the “b” coefficient in the context of the charts is formed by two coefficients: tangent of the angle of the line and the coefficient that characterizes the currency pair (probably Point), so the scale of the indicator is different on different currency pairs.
How to use the indicator? I think there are several variants:
1. crossing the zero line.
2. maximum value passage.
3. if you determined a zone near the zero line then it is a flat and you can trade on a break through.