TradeBreakOut
TradeBreakOut
The TradeBreakOut indicator reveals distance from the actual price (Close or Maximum/Minimum prices) up to the breakthrough of recently set support or resistance levels which were defined using local maximums and minimums.
Input Parameters:
- L (default = 50) — indicator period. The higher the value is the fewer breakouts are signalled but the better their quality.
- PriceType (default = 1) — the type of price used in the calculation. Theoretically, the closing price is more suitable for daily/weekly periods. High/Low is more suitable for short-term periods. (0 — Close Price, 1 — High/Low).
Recommendations:
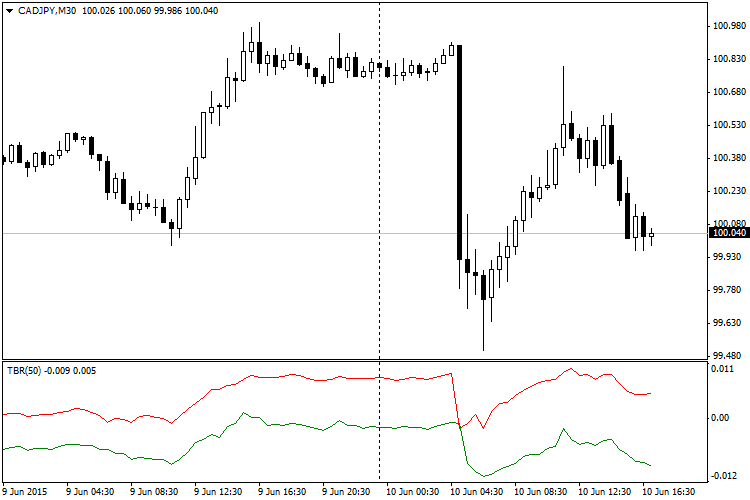
- The above chart shows the TradeBreakOut indicator using the default values. When the green line reaches the zero point moving upwards, it speaks of the bullish breakthrough of the local maximum. When the red line reaches the zero point moving downwards, it signals about the bearish breakthrough of the local minimum. The more the distance from the zero levels to the zero, the less the possibility of the breakthrough.