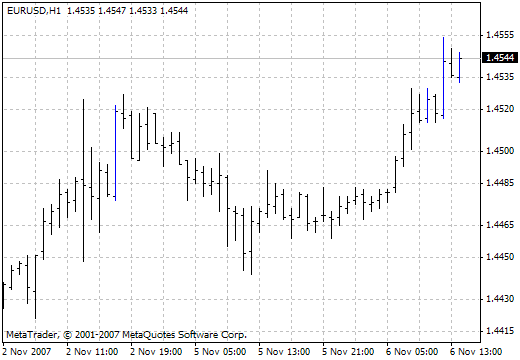
Three Line Break
Three Line Break
This method has been described by Steve Nison in the book “Japanese Candlestick Charting Techniques”. “Three-Line Break” combines the qualities of the “tic-tac-toe” charts and the standard line charts or bars.
The literature notes the advantages of future price movement prediction methods based on the calculation of the duration of pricing models.
This chart allows to easily eliminate the noise and to efficiently place such points, support and resistance levels, graphical shapes. It should be noted that the appearance of graphical shapes on a usual chart differs from those on a Three-Line Break chat, caused by the non-linearity of the time scale.
In a sense, this type of chart converts the price movement into a range of cyclical fluctuations.
