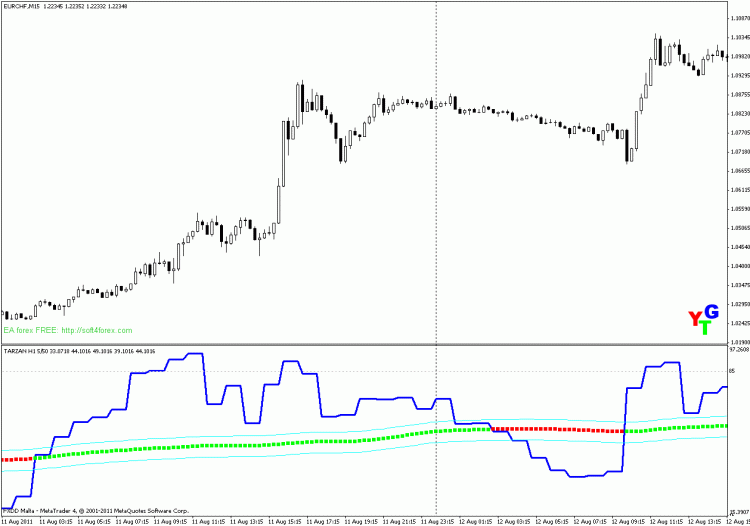
TARZAN
TARZAN
Trend indicator.
Input parameters:
- TimeFrame = 60; the period of the diagram can be any of the following sizes:
1 – 1 minute;
5 – 5 minutes;
15 – 15 minutes;
30 – 30 minutes;
60 – 1 hour;
240 – 4 hours;
1440 – 1 day;
10080 – 1 week;
43200 – 1 month;
0 (zeroes) – Period of the current chart. - RSI=5; period of RSI indicator.
- applied_RSI=0; the used price. There can be any of price constants:
0 – Close price;
1 – Open price;
2 – High price;
3 – Low price;
4 – Average price, (high+low) /2;
5 – Typical price, (high+low+close) /3;
6 – Weighed price of closing, (high+low+close+close) /4. - MA=50; period of Moving Average indicator.
- method_MA=0; – a method of averaging. Can be any of meanings(importance) of methods sliding average (Moving Average):
0 – Simple moving average;
1 – Exponentially smoothed moving average;
2 – Smoothed moving average;
3 – Linearly weighted moving average. - koridor = 5; a threshold of an envelope.
