Support – Resistance
Support – Resistance
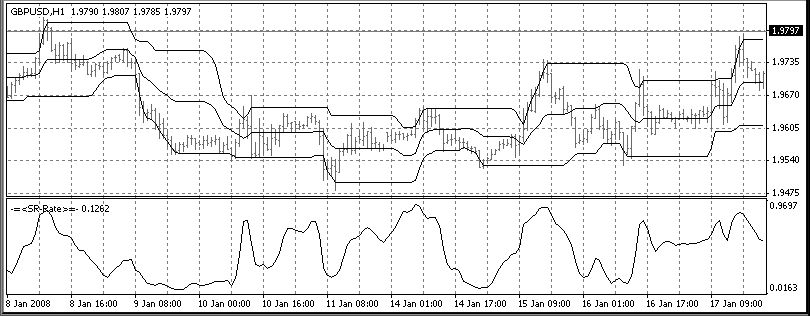
Support-Resistance Indicator, as its name says, is intended to detect and display Support/Resistance levels.
The midline is the mean value between support and resistance.
The indicator has an external parameter, it’s its window width. Thus, you can see daily levels on a one-hour chart, if you set the window width to 24.
SR-Rate Indicator shows the border the price is closer to.
OneSideGaussian must be stored in \libraries.
Of course, you should store the other two files in \indicators.
They should be used all together only.