Stowell’s Three-Bar Net Line
Stowell’s Three-Bar Net Line
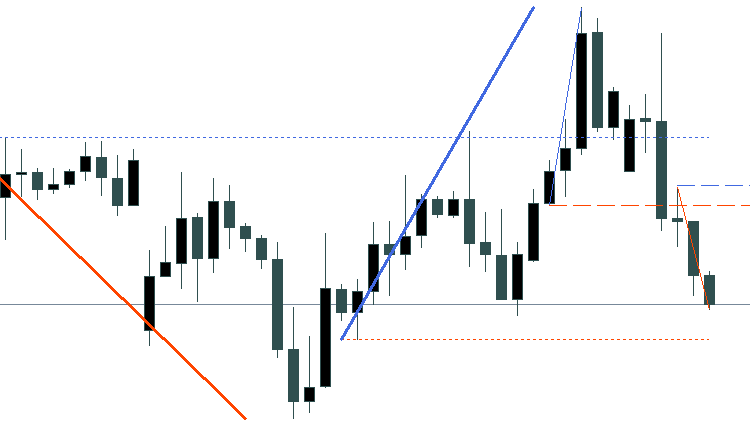
The indicator plots two Stowell patterns on the right edge of the chart: upper and lower. A breakout of the three candle line means (by Stowell) a change in the trend.
Both files must be compiled. Only the second file is attached to the chart.
Input Parameters:
- The BreakOnly=false parameter means that any formed patterns will be plotted (fig. 1).
- The BreakOnly=true parameter means that only the formed patterns, that had a breakout, will be plotted (fig. 2).
This is a multi-timeframe indicator. The timeframe is specified by TF (TF=0 means the timeframe of the current chart).