Standard Deviation
Standard Deviation
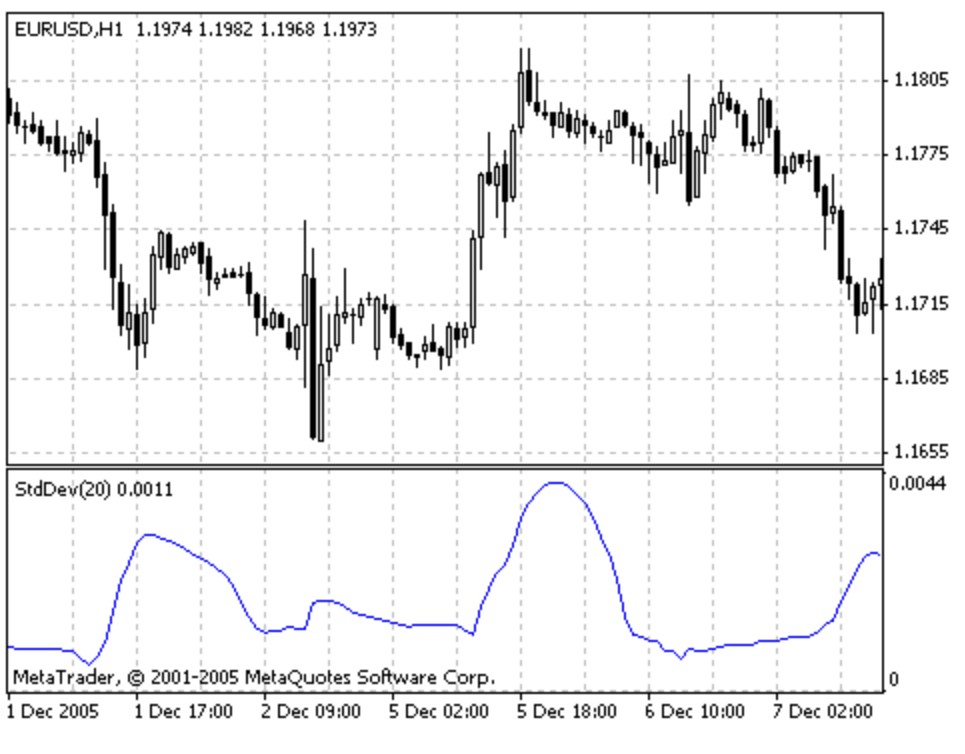
The Standard Deviation Indicator (StdDev) measures the market volatility. This indicator describes the price standard deviation value relative to the Moving Average.
The higher the Standard Deviation is, the more instable (volatile) the market is, i.e., bars prices are rather dispersed relative to the moving average. Opposite, the lower the deviations is, the more immovable the market is, i.e., the bars prices are approaching to the moving average very much. It is known, however, that the market dynamics consists in interchange of quiet periods and activity spikes.
So, the approach to this indicator is simple:
- if the indicator value is too low (i.e., if the market is completely calm), it would be reasonable to expect the activity spike soon;
- on the contrary, if the indicator is extremely high, this means that the activity will slow down soon.
Calculation
StdDev (i) = SQRT (AMOUNT (j = i – N, i) / N)
AMOUNT (j = i – N, i) = SUM ((ApPRICE (j) – MA (ApPRICE (i), N, i)) ^ 2)
where:
- StdDev (i) — Standard Deviation of the current bar;
- SQRT — square root;
- AMOUNT(j = i – N, i) — sum of squares from j = i – N till i;
- N — smoothing period;
- ApPRICE (j) — the applied price of the j-th bar;
- MA (ApPRICE (i), N, i) — any moving average of the current bar for N periods;
- ApPRICE (i) — the applied price of the current bar.