Simple Horizontal Grid
Simple Horizontal Grid
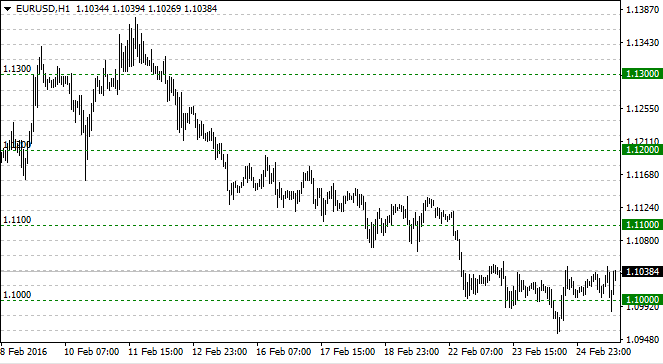
The indicator places a series of equidistant adaptive horizontal lines on a chart. The lines are updated with every chart change and are independent of symbol or scale. If the user changes the vertical scale, the indicator adds or removes lines accordingly.
The lines have two colours, the primary colour is dedicated to lines glued to round numbers, the weak colour is for secondary lines equidistantly placed between the round-number lines.
The user may swap their colours.
The indicator works out of the box, but the user may adjust a few parameters.
Additional input settings:
- the density of lines (distance between lines)
- number of secondary lines between two primary lines
- switch off displaying the primary line labels on the scale
Recommendations:
The standard grid should be switched off (ctrl+G) when using this indicator
Switching the object descriptions on (F8 – Show Objects Description) makes visible line labels on the left. They may be used as a substitute for the hidden scale labels.