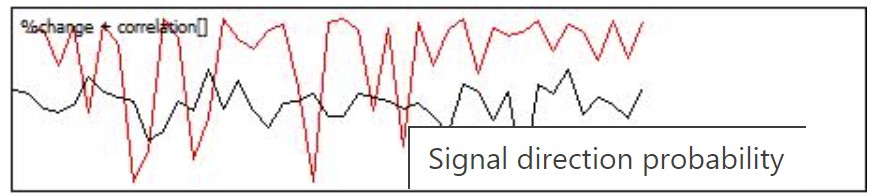
Signal Direction Probability
Signal Direction Probability
- This indicator determines the per cent change between previous closing prices, for the length of the array, and draws the per cent change signal in the indicator window. After the per cent change is determined, the correlation between the price signal and per cent change is calculated and drawn(red line is the correlation and the black line is the per cent change).
- In theory, if there is a high correlation(greater than 0.7) between per cent change and price signal, then the price signal should continue in the same direction. For example, if a price signal is moving upward, and the correlation(red line) between the price signal and price per cent change is high, then the price should continue to keep moving in the same direction, which generates a buy signal. A sell signal is generated, if the correlation between the price signal and the per cent change is high and the price signal is moving downward.
Note: for the correlation(red line) to appear, the indicator needs to have at least two ticks. The first tick calculates per cent change, the second tick calculates the correlation between a price change and price signal.