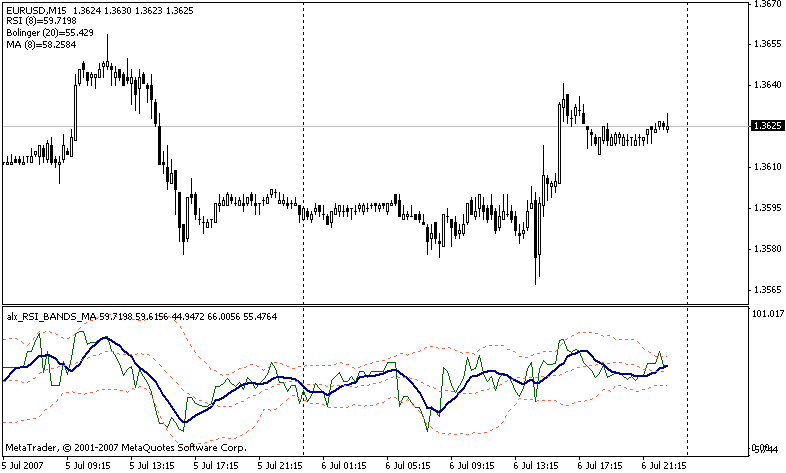
RSI_BANDS_MA
RSI_BANDS_MA
The MA is calculated based on the data of the RSI, the Bollinger displays the channel.
When the RSI is in an overbought area and goes down, while crossing the MA, it is a remarkable sell signal. The buy signal is exactly the opposite. And if there is a divergence between the MA of the price and the MA indicator of the same period, then it is really good. It is recommended to monitor the signal on several timeframes. Preferably D1, Н4, Н1, М5.
