RSI DeMarker Super Position
RSI DeMarker Super Position
As a rule it takes a lot of time to switch between periods and indicator parameters for comparing their behaviour and detecting true indicator development dynamics.
The indicator was developed after the working area was filled by a set of standard indicators with different parameters.
What is calculated:
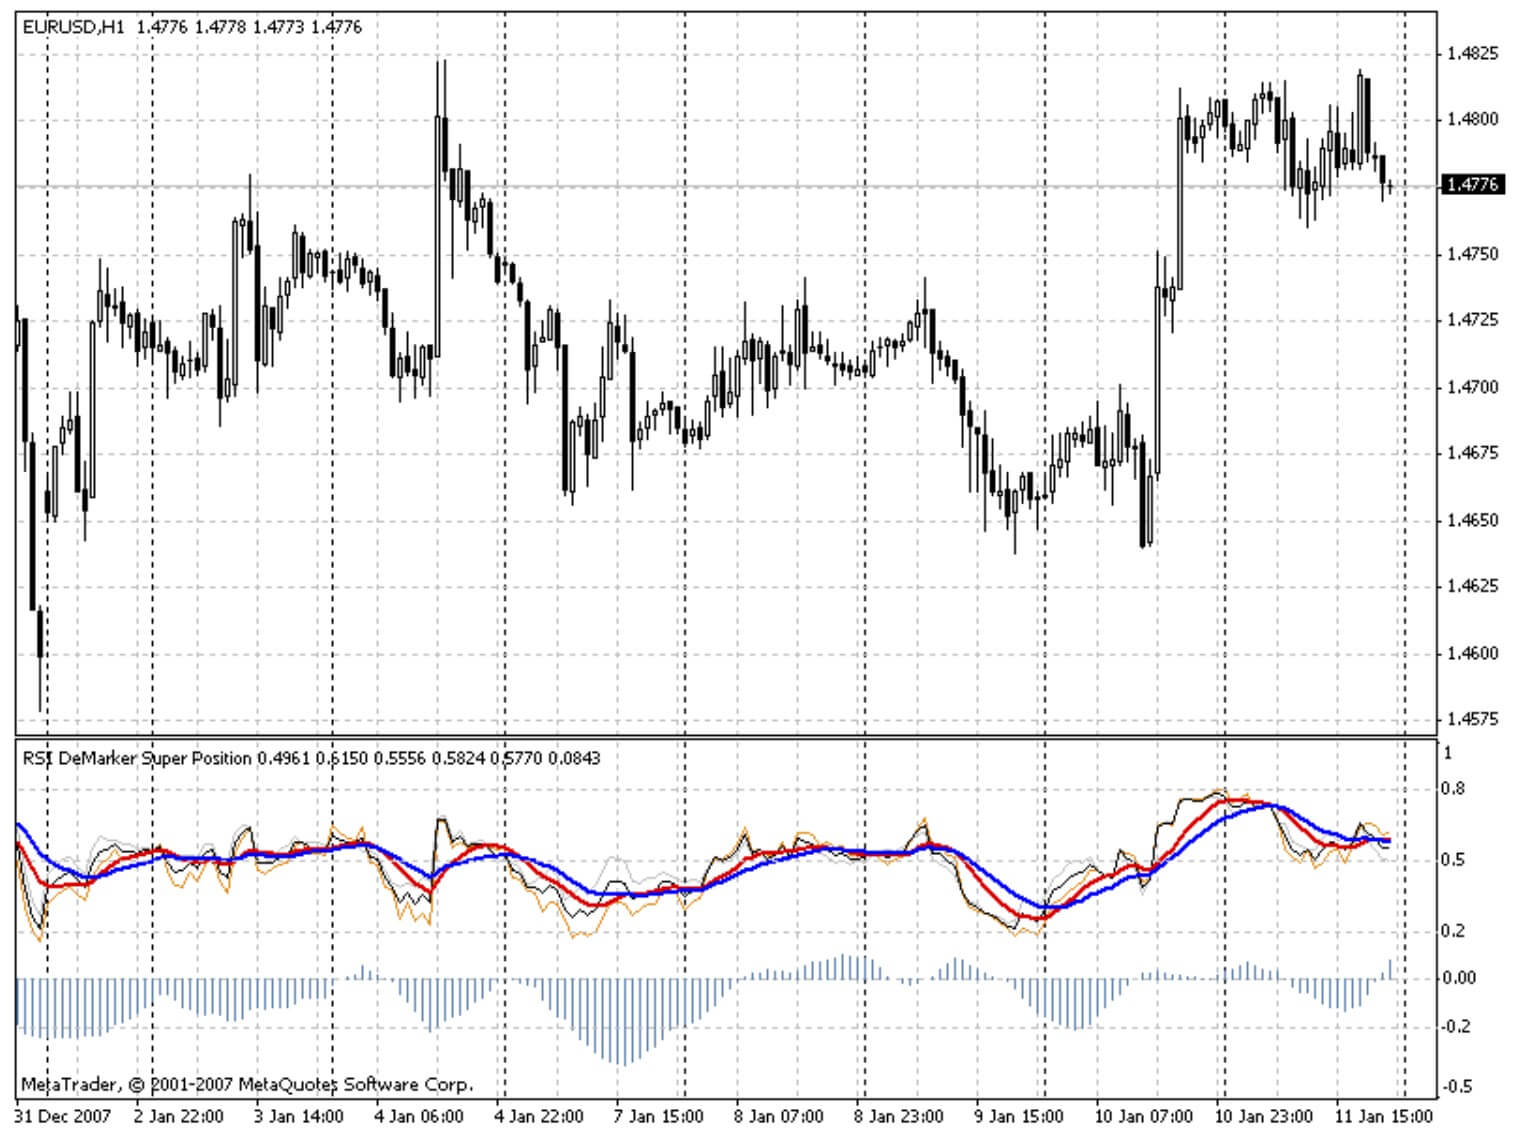
- four RSI lines with different periods (the period change step is specified in the indicator parameters) constitute a weighted average of the indicator upon RSI;
- four DeMarker lines with different periods (the period change step is specified in the indicator parameters) constitute a weighted average of the indicator upon DeMarker;
- because of the difference of RSI and DeMarker dimensions, the values of averages are reduced to a common way of displaying;
- the moving average upon RSI and DeMarker constitute a superposition upon two indicators;
- two MA lines are attached to the superposition line for an easier interpretation of values;
- for better visualization, a histogram of the difference between RSI and DeMarker weighted averages is shown.
The result is: one indicator contains two values of different periods and different dynamics.
RSI and DeMarker behave differently not only in different situations on a chart but also towards themselves with different indicator periods. I think it is useful to see this difference.
In addition to this, a smoothing of the superposition line can be introduced.