Regression Сhannel
Regression Сhannel
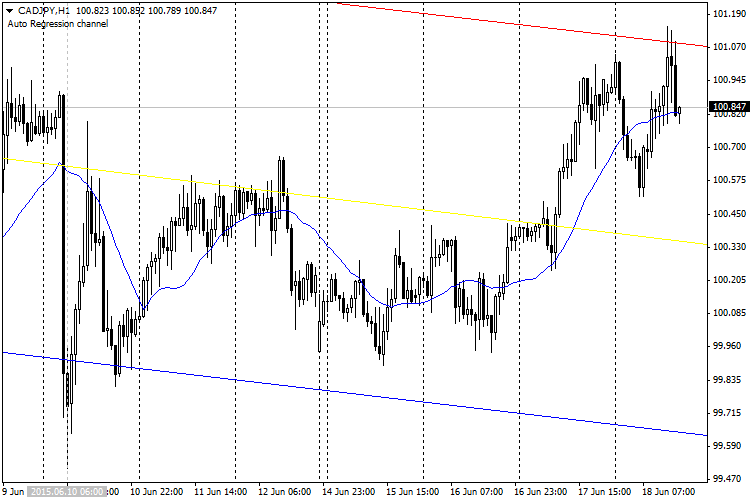
The channel indicator plots a linear regression channel. First, the indicator draws a trend line between two dots, then on its basis plots a channel of two parallel lines, which will be located at the same distance from the regression line. The distance to the regression line depends on the value of the maximum deviation of the closing price from the average line. If the price reaches the channel boundary or, which is better, crosses it, then the trend reversal is incoming.
The indicator proved itself best on the higher timeframes.