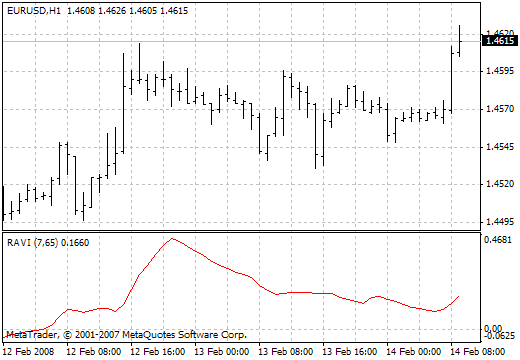
RAVI (Range Action Verification Index)
RAVI (Range Action Verification Index)
It is developed on the other principle, not on ADX’s. Chand suggests 13-weeks SMA as a basis of the indicator. It represents the quarter (3 months = 65 working days) behaviour of the market populace about price. The short average is 10% of the long one and is roughly equal to seven.
T. Chand recommends the following information lines for the indicator: plus-minus 0.3% or 0.1% (depending on the market). There is a belief that the uptrend began if the indicator crosses the upper information line bottom-up. And there is also a belief that the downtrend began if the indicator crosses the lower information line from top downward. The trend is considered as continuing as long as the RAVI line grows. The downtrend – as long as the RAVI line falls. If the indicator turns back to the zero lines, the trend is over and the channel has begun. But if the indicator turns back again not passing between the information lines, the trend has resumed.
The indicator in itself is very simple and is almost identical to the Price Oscillator and MACD. The unique thing is the usage of the convergence-divergence rate indicator as a trend pointer, paying attention to the divergence exactly and not to the intersection of the average.
If we consider the method of ADX drawing then we can note that the indicator has two smoothings. RAVI has one smoothing. This makes the indicator more sensitive, and it alerts about the beginning and the end of the trend earlier than the 18-days ADX.
