PriceHistogram Channel
PriceHistogram Channel
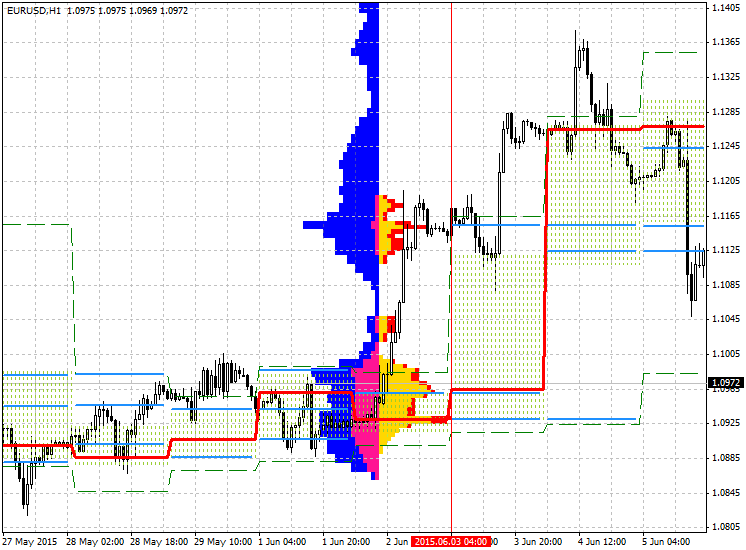
This indicator shows channels using the price histogram.
Display:
- redline — top of the histogram;
- dot area — where 60% trades take place;
- dash line area — where 90% trades take place;
- blue lines — other peaks (1-3 line).
Settings:
Calculation time (hour): 4
Histogram period (day): 3