Price Action Indicator
Price Action Indicator
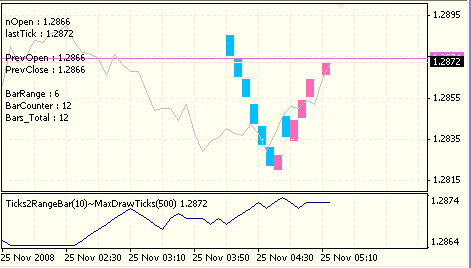
This indicator plots in the chart base on the tick price, ie. when the price moves down 10 pips it plots the down candle and wait till the next 10 pips if move up 10 pips it plots the up candle with the other color candle to indicate the up down price . It only plots when the price range has reached a specific amount of pips that you can specify.
Recommendations:
Attach the indicator on the line chart to see the price up and down candle
