MoneyManagement visualizer
MoneyManagement visualizer
This indicator will help traders in calculating lot size by dragging horizontal lines (Risk Management and Money Management).
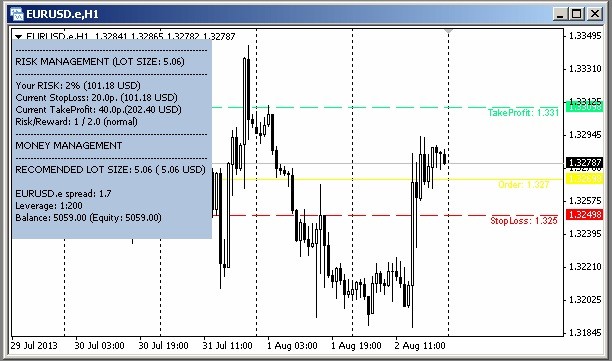
Add a horizontal line on your price graph and name it as “s” (like “starter”). This will add three horizontal lines (named: sl = StopLoss line, tp = TakeProfit line, order = OrderLine) with default parameters eg TakeProfit = 40p, StopLoss = 20p. You can drag these lines up and down. On the left top corner, you will see calculations of risks and money management.
This indicator has only one parameter Risk percentage per one order. I use 2% of risk per order (this is also the default parameter).
All you need is a “RECOMMENDED LOT SIZE” line where you can see the calculated lot size for the next order. NB! Calculations are made based on AccountDeposite