madnessMA
madnessMA
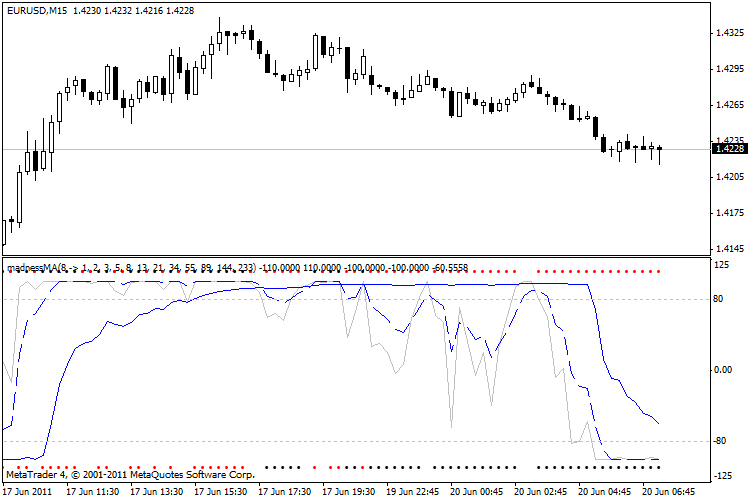
This indicator calculates the correlation between MAs of different periods.
Lines:
- Black/Red dots – Shows Open/Close signals (Above chart = BUY, below = SELL)
- Silver Line – Trend correlation (100 = All MAs are UP trend, -100 = All MAs are DOWN trend)
- Blue Line – Sort Degree (100 = All MAs are ASCENDING, -100 = All MAs are DESCENDING)
- Blue Dashed Line – Rough Sort Degree between MAcheck, Higher MAs and Lower MAs (100 = All Higher MAs are above MAcheck and all Lower MAs are below MAcheck, -100 = Higher MAs < MAcheck < Lower MAs; Higher and Lower MAs don’t have to be sorted)
