Madlen_5_0
Madlen_5_0
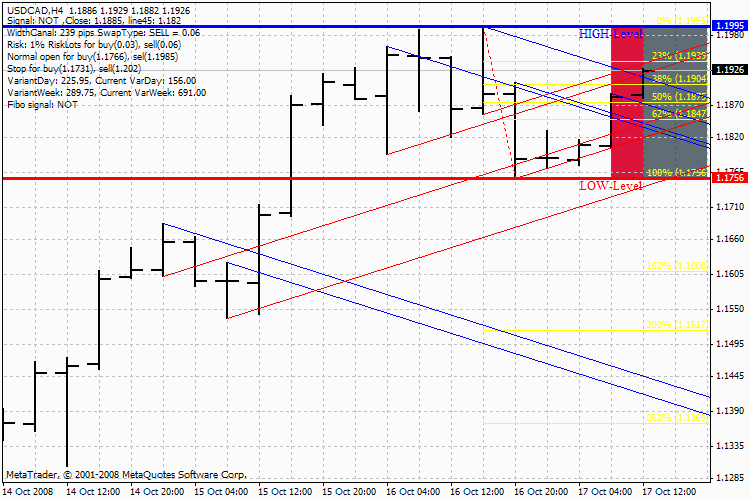
The «Madlen» lines are similar to the lines of support and resistance of horizontal or trend lines by their application. They have a good feature – there are no fallacious breaks through or activation, you can call them even the “true trend lines”.
The line begins its existence since it is drawn by a signal. If a line is being drawn bottom-up and is inclined by 45 degrees then it is the support. And if the line is being drawn from top downward and is inclined by 315 degrees then it is the resistance.
The more interest there is to the support or resistance the more opposite interest will be to that same lines in future. Namely, the lines of support will turn to the lines of resistance and vice versa, resistance will turn to support. The closing of the candlestick’s body beyond the region of the line or the opening of the body of the new candlestick beyond its region can serve as a signal to it. So the lines form the parallel trend channels the price moves within. Besides the channels, different kinds of triangles are formed.
Here you should pay attention to the middle of the triangle and at the time of its ending. The moving of the price inside the triangle gathers momentum and then exportation beyond its limits occurs. The triangles are formed with different colours of lines, and the channels are formed by one of the colours.