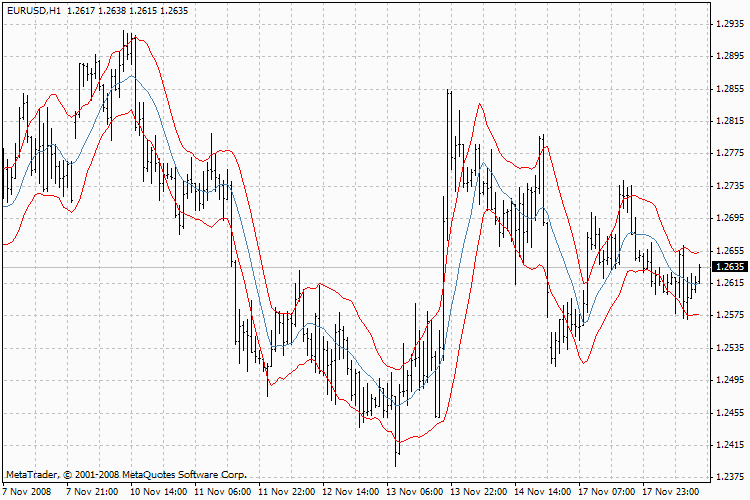
Keltner Channel
Keltner Channel
The Keltner Channel indicator determines the most significant trends. The indicator is based on principles similar to the ones of Bollinger’s “envelope” and bands: the difference is the average true range is used here instead of the percents (“envelopes”) or the standard deviations (Bollinger bands). The upper line is calculated as the moving average plus the average true range for N periods. The lower line is the moving average minus the average true range.
As a rule, the upper line denotes the “overbuying” of the market and a big probability of a down-directed correction. The lower line corresponds the “oversold” market and denotes a big probability of the correction directed upwards.
