Basket Viewer
Basket Viewer
This utility allows monitoring of multiple symbols and positions on one chart, with one group for long (buy) symbols, and another group for short (sell) symbols. There are 7 default symbol pairs in each of the groups. The user may change these and enter up to 50 symbols from their market watch in either of the long or short baskets for viewing.
The current display chart can be changed to any of the symbols of the symbol in the indicator display with a click on the symbol. Statistics including ATR for the chart period points gained or lost from a week’s start and position gains or losses, and lots of exposure are displayed. The statistics week may be changed with simple clicks on the display, and the display may be dragged and dropped to a different location. The load on quote processing is kept low by simply posting an event that starts the processing for a display update instead of running the update inline with the quote processing.
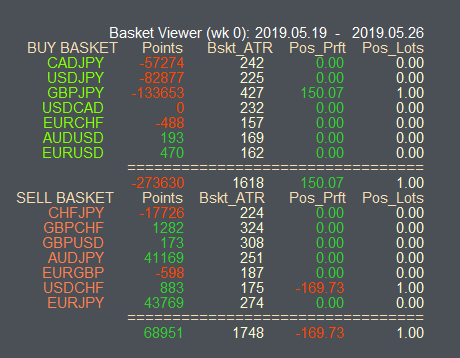
“Basket Viewer (wk 0): 2019.05.19 – 2019.05.26”
Click “Basket Viewer” to select the object and drag and drop the panel to a different location on the chart.
Click the first date (2019.05.19) to increment the week being displayed.
Click the 2nd date (2019.05.26) to decrement the week being displayed.
“BUY BASKET Points Bskt_ATR Pos_Prft Pos_lots”
Click this line to highlight the currently selected week on the chart (draws a rectangle over the week). Click a 2nd time to remove the rectangle.
“BUY BASKET” is the list of pairs extracted from the User controllable “Buy Pairs String”. Click the individual ‘pairs strings’ to change the chart to that symbol.
“Points” is the Open of the week subtracted from the close of the week (close – open). This is based on the week selected, (default is week 0, the current week).
“Bskt_ATR” is the atr for the symbol for the week in the chart’s time frame. This is based on the week selected, (default is week 0, the current week).
“Pos_Prft” is the profit or loss from any active trades on the symbol. In the picture, there is a $150.07 profit on GBPJPY. This does not change based on week selected.
“Pos_Lots” is the exposure to the indicated symbol. In the picture, there is a 1 lot exposure shown on GBPJPY. This does not change based on week selected.
As can by seen in the below display, this header is followed by the buy pairs statistics, including a total for the Points, ATR, Prft and Lots columns.
“SELL_BASLET Points Bskt_ATR Pos_Prft Pos_Lots”
This is a repeat of the “BUY Basket” header for the “Sell Pairs String”. There are no event actions for clicking this display line. As can be seen in the below display, this header is followed by the sell pairs statistics, including a total for the Points, ATR, Prft, and Lots columns. The totals are opposite from the Buy Basket – for example, profit points are (open – current/close) price for the week, versus (current/close – open) for the Buy Basket.