Hodrick-Prescott Channel
Hodrick-Prescott Channel
First, the filtered Close price values are calculated. Then, they are filtered over a larger period. The result is two arrays: HP and HPSlow. The next step is the calculation of the standard deviation of the HP relative to the HPSlow and channel plotting.
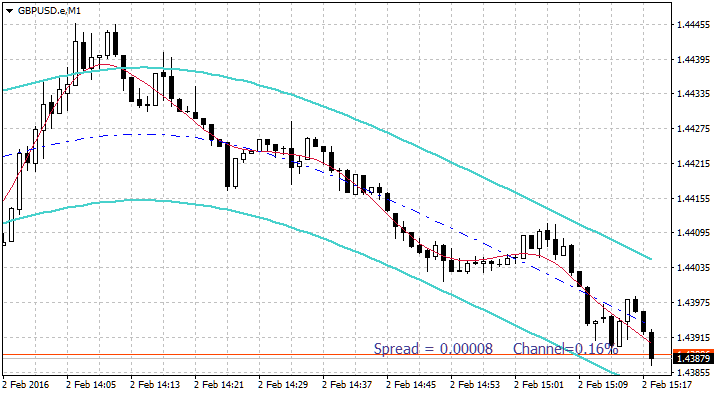
The indicator displays the value of the average spread and the ratio of the channel width to the HPSlow value on the zero bar as a percentage in the bottom right corner of the chart. Double click the text label to drag it to the desired location. It can be deleted by pressing the DEL key. The text reappears when switching timeframes.
How to correctly interpret the values of this channel?
This channel is based on the Hodrick-Prescott filter, which is one of the digital filters without delays. These types of filters look beautiful compared to the Moving Average, but they are redrawn at every new bar.
Why is this happening? In fact, it is mathematically impossible to implement an “honest” filter without delays. Any filter will have a delay equal to or greater than the number of bars set for averaging. This can be easily seen by changing the period in the Moving Average indicator. The greater the period, the better the smoothing, but the greater the delay.
There is only one way to remove the delay. The pure form of the algorithm is as follows: it is necessary to filter the input bars from left to right first, then filter the resulting sequence once again, this time from right to left. Moreover, the initial direction does not matter, as long as the second filtering is performed in the opposite direction.
In fact, the various filters without delays offer different degrees of compromise between the delay and the smoothing. But it must be clearly understood that perfection can not be achieved, as it is not possible to tell the future.
This filter must be used to determine the instant (at the level of several new bars) direction of the price movement. If both this channel and the Standard Deviation channel are attached to the chart, it will be evident that their directions are close to each other near the first (rightmost) bars. But if the Standard Deviation channel is plotted by three straight lines, this channel shows the direction of the price in history with a certain degree of accuracy. Moreover, the deeper the history, the lower the level of accuracy.
During the adaptation of the indicator to the MQL4, I specifically added the code that draws the “tails” of the channel. Run it in the М1 timeframe, wait for half an hour without changing the timeframe, and you will see the channel wagging its “tail”. The “tail” disappears when switching timeframes.
It is recommended to use the indicator for scalping, it is not suitable for long-term strategies or for replacing the “honest” Moving Average.
Indicator input parameters:
- HP Fast Period — the HP filtering period;
- HP Slow Period — the HPSlow filtering period;
- FontColour — font colour.