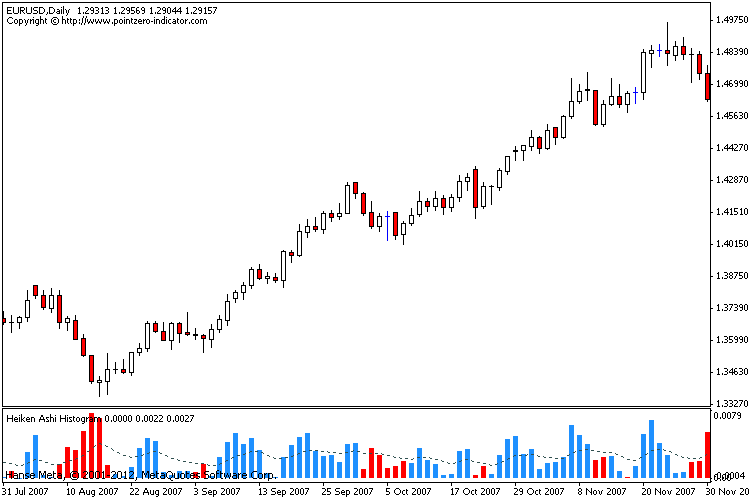
Heiken Ashi Histogram
Heiken Ashi Histogram
This indicator displays the colour of the Heiken Ashi candles and the rate of immediate change on a histogram, with a moving average that represents the average change. If Heiken Ashi bars suddenly change colours and the new bar is above the moving average, it is likely that the change was strong enough to continue for a while.
The moving average can also be used to detect range-bound markets and can be a good add-on to your trend following or short-term trading strategy.
