Figurelli RSI
Figurelli RSI
The main idea of the proposed RSI is better to detect the signal overbought/oversold situations using larger periods for better trend detection in any timeframe.
For this, I did some changes to it perform as good for greater periods, like 120, introducing gain variable.
So, if you use 120 periods in the original Wilder RSI, you can inject gain to see the graph as well as small periods.
Parameters description:
– period: original RSI period
– gain: gain injected for greater periods better visualization
Example photo:
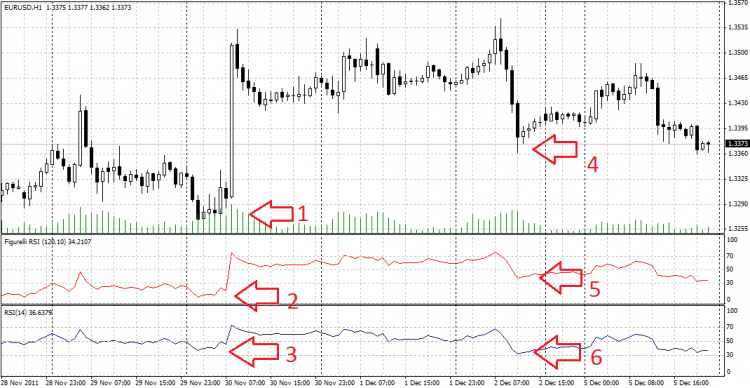
in the graph, we have the two indicators comparison: Wilder RSI (blue) x Figurelli RSI (red)
– our target is better to detect signal points [1] and [4]
– note that the original RSI with period 14 detects points [3] and [6] are almost the same, but points [1] and [4] are very differents
– in Figurelli RSI with period 120 and gain 10, we can see points [2] and [5] that better detect the signal overbought/oversold situations