Easy Trend Visualizer
Easy Trend Visualizer
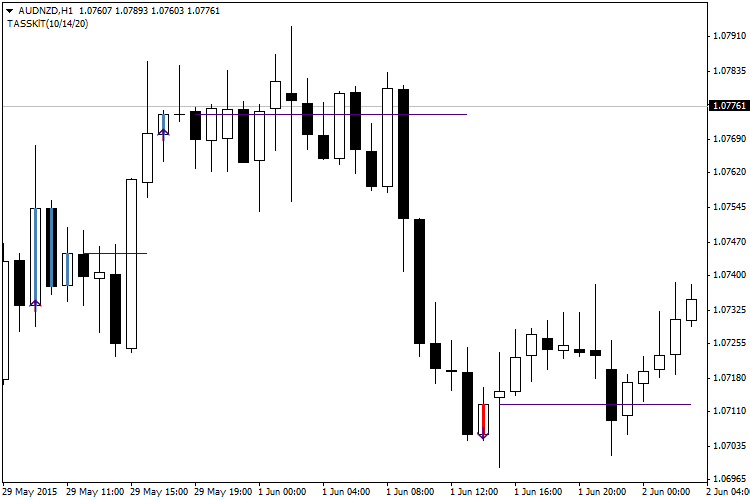
Easy Trend Visualizer — a simple visualizer of trends. This indicator does exactly what its name says. It shows where the trend starts and ends and where the trend is absent at all.
It is based on standard ADX (Average Direction Movement Index) indicators and works quite fast. Easy Trend Visualizer is displayed in the main chart window.
Input Parameters:
- ADXperiod1 (default = 10) — period of the first ADX indicator.
- ADXperiod2 (default = 14) — period of the second ADX indicator.
- ADXperiod3 (default = 20) — period of the third ADX indicator.
- UseAlert (default = false) — if true, generates signals when starting to plot the horizontal line.
Recommendations:
- Unfortunately, this indicator redraws on the current bar, so it can not be used to enter the position at the current bar. The previous bars are not redrawn and can be used as signals for entry. Although this is a fairly accurate indicator, it also generates a lot of false signals, but with the help of moderate levels of stop-loss, it is possible to avoid serious losses. It is also important to exit the position immediately after the trend ends.