Doda-Bollinger Bands
Doda-Bollinger Bands
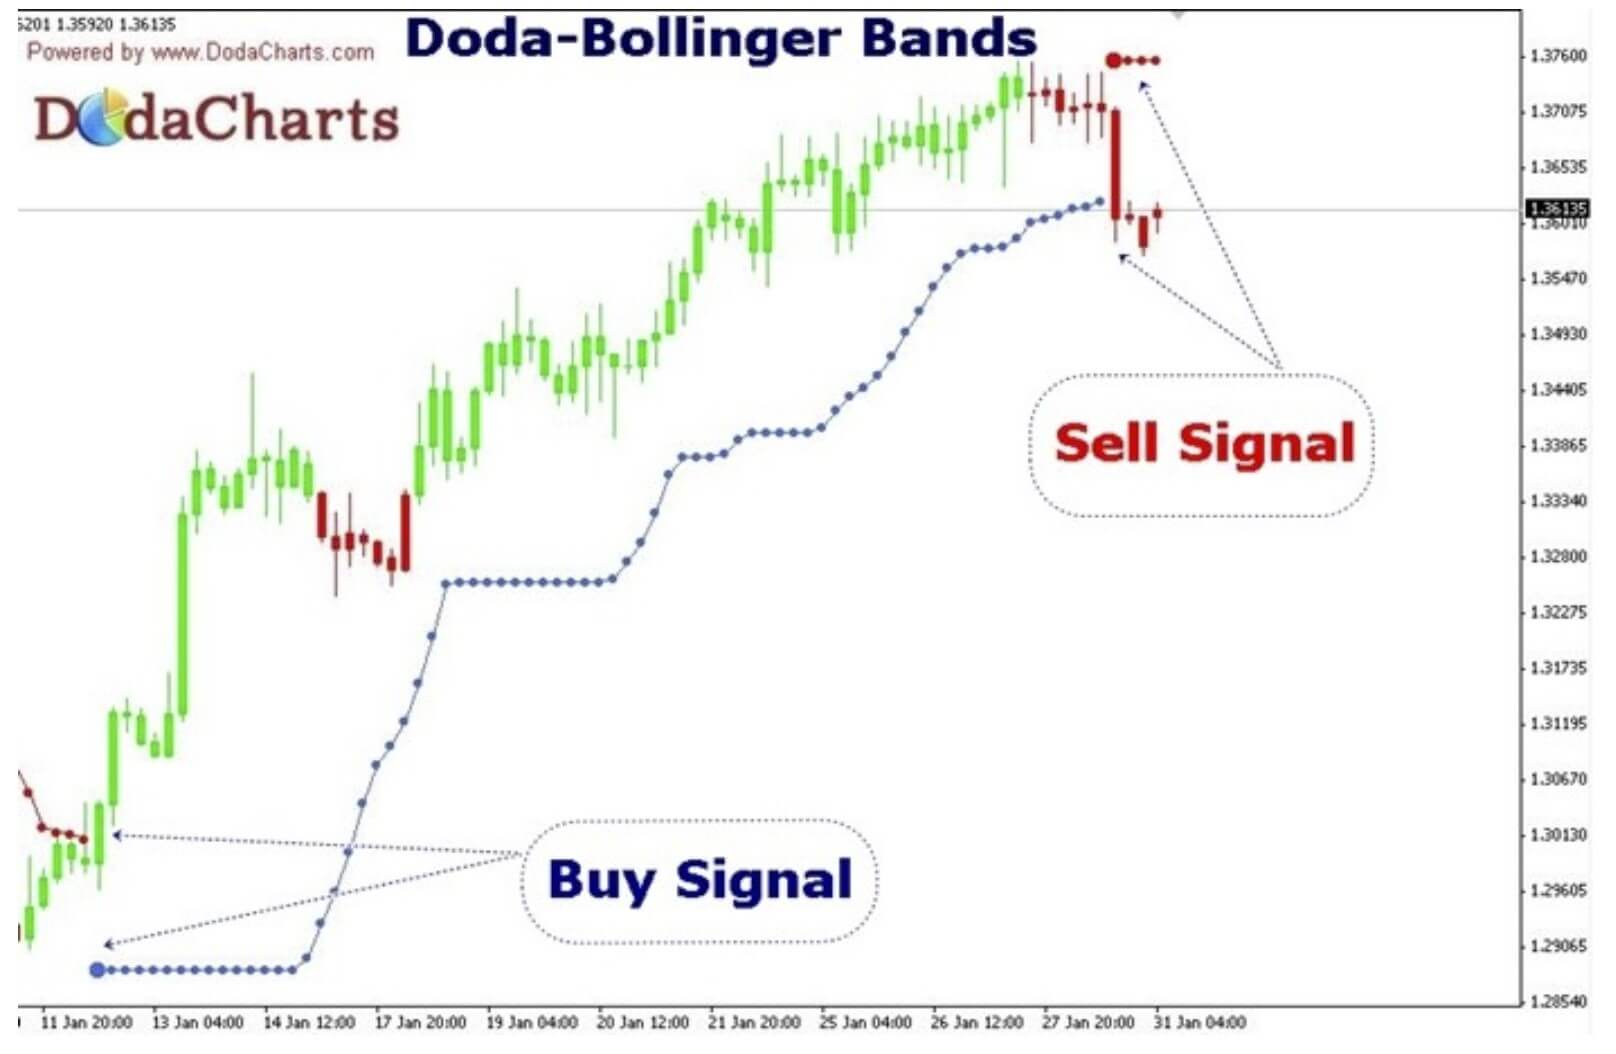
Bollinger band is one of the famous indicators. But it’s the implication of 3 lines confuse sometimes and one can not take proper action on time. So, here is the modified version of the Bollinger band. You’ll get a single line here.
Usage is simple. Buy when the price closes above the red line and you see a blue line. Sell when the price closes below the blue line and you see the red line. The sample image below is self-explanatory. The chart is the latest EURUSD pair on the H4 time frame. You can easily spot the starting of the bull run and now starting of the bearish phase.
Lastly, I’ve modified the code to great extent. It was originally by TrendLaboratory. So, the basic coding credit goes to them.
Recommendations:
- Works best on higher time frame like H4
- Works on all currency pairs but good on stable pair like EURUSD
- Take action on CLOSING of the candle and not on just touching the blue or red lines.
