Colored MA
Colored MA
Colored MA – Color Moving Average. Alternative usual MA. Draws exponential Moving average with the specified period marking various colors movement upwards and downwards.
Draws exponential Moving Average with the specified period marking various colors movement upwards and downwards.
Using:
Can be used for development of the TS.
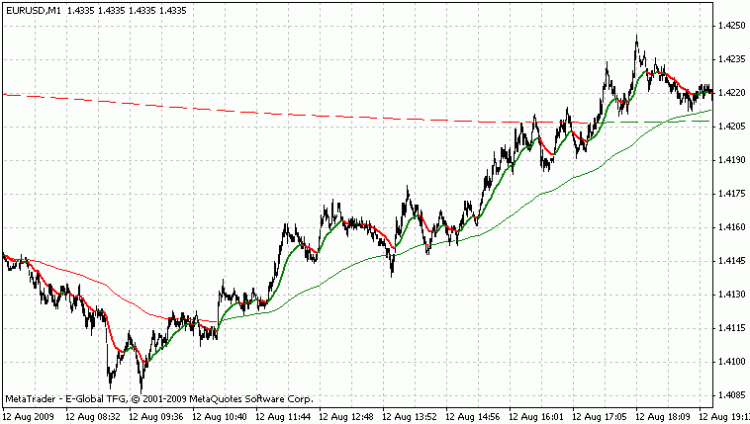
In figure an example of three Color MA with the different periods:
- Fat – the fastest, the period: 24
- Thin – the period: 182
- Dotted
– the slowest, the period: 6000
Fat (24) quickly reacts to rises and falling.
At the same time Thin (182), remaining former GREENcolor, specifies, that those RED falling are only corrections at the general GREEN i.e. ascending local trend.
And at last, Dotted (6000) unequivocally reminds of the descending global tendency.
