ClusterBox_Histogramm – horizontal cross-section of the market
ClusterBox_Histogramm – horizontal cross-section of the market
For each candlestick of any timeframe, there is a corresponding amount of ticks that formed it. On Forex charts this trait is displayed as Volume, although it has no direct relation to the real trade volumes. However, the tick volume data can be in the same way as the real volume data.
The information about the ticks that came before the indicator was attached is taken from the special tick file, which is formed with the help of the Ticks collector. A ready-made tick file can also be taken from the archive. If the history rendering is not required, then the indicator values will appear in real-time, provided the new ticks arrive.
About the ClusterBox_Histogramm indicator
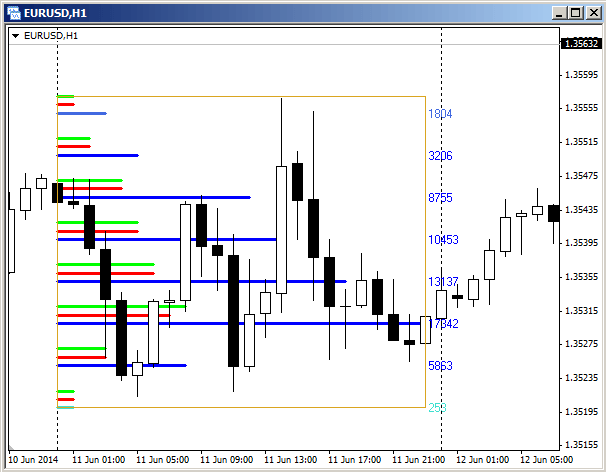
Unlike the ClusterBox indicator, which displays the number of ticks per one cluster within a single candlestick, the ClusterBox_Histogramm indicator calculates the number of ticks of one cluster, which combines several candlesticks. That is the specified interval of the candlesticks is considered as a single candlestick split into clusters. For each such cluster, the number of ticks within it is calculated.
The blue and light blue lines on the chart — the total amount of ticks per one cluster. The precise value of this number is displayed to the right of the rectangle, which bounds the data collection interval. The colours of these lines depend on the number of ticks and values of the setting parameters of the “Min. volumes and colours” block.
Red and green lines — the number of ticks per fall and growth prices respectively. Set in the “Delta of volumes” parameters block.
The data collection interval is set by moving and/or dragging the rectangle.