Bounce Strength Indicator
Bounce Strength Indicator
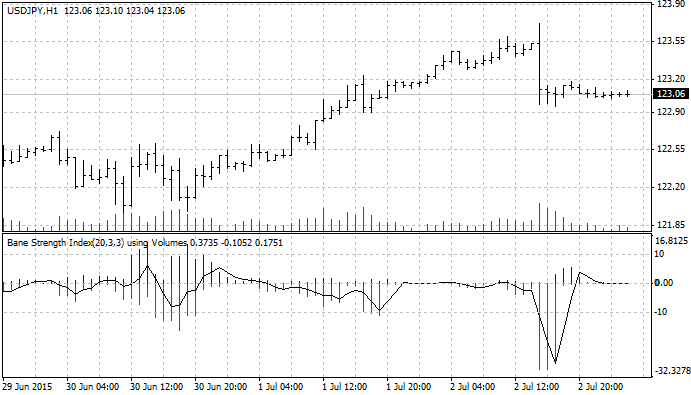
Bounce Strength Indicator (BSI) shows the strength of bounce according to the Wyckoff method.
After a move higher, the stock moves into a flat consolidation with a clear support level. Chartists should watch the action closely as prices approach to support. A high volume surge off support, also known as a springboard, is the first sign that the bigger uptrend is set to continue and a consolidation breakout is imminent.
How to measure the strength of bounce?
Strength of bounce up from lows:
(close – low ) * ( ceiling – low ) / range spread
Strength of bounce down from highs:
(high – close) * ( high – floor ) / range spread
My measuring method means the following:
- The greater the rise from a lower position, the stronger the buying pressure.
- The greater the fall from a higher position, the stronger the selling pressure.
This idea is simple, but it can become a leading indicator of the range breakout. It will work only within range.
Display:
- plus histogram — shows the bounce strength up from lows;
- minus histogram — shows the bounce strength down from highs;
- middle line — an average of the difference between plus/minus.