Bounce Strength Indicator 2.0 with Tango Line
Bounce Strength Indicator 2.0 with Tango Line
Bounce Strength Indicator (BSI) shows the strength of bounce. It now works in trend and uses Tango Line calculations.
There is no difference in the basic concept, but I tried to remake it from a different angle.
I used the width of the range as a measure to measure (like a classical oscillator). This version does not use the width of the range. It uses the deviation from the centre line instead. And the centerline is the moving average of the Tango Line.
Display:
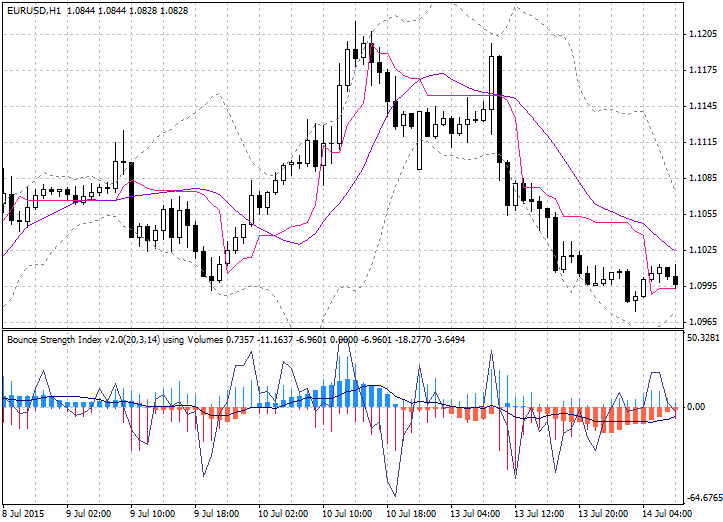
- Plus histogram — shows the bounce strength up from lows.
- Minus histogram — shows the bounce strength down from highs.
- Signal line — difference between plus/minus [ (plus – minus) * abs((plus-minus) / (plus+minus)) ].
- Blue box — uptrend strength (average of Signal line).
- Red box — downtrend strength (average of Signal line).
- Slow Line — an average of Signal line (long span).
Settings:
//--- input parameters
input int InpRangePeriod=20;            // Range Period
input int InpSlowing=3;                 // Slowing
input int InpAvgPeriod=14;              // Avg Period
input bool InpUsingVolumeWeight=true;   // Using TickVolume
input double InpReversalNoiseFilter=5;  // Noise Filter
input  color InpSigColor=DarkSlateBlue; // Signal Color
input  color InpSlowColor=Navy;         // Slow Color