BOBB
BOBB
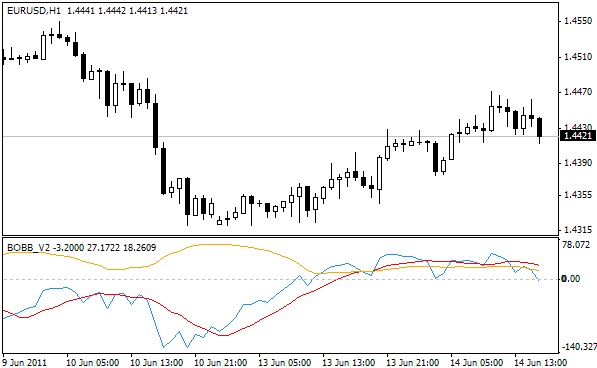
The orange line shows width.
If the blue line crosses zero-line to above it’s a breakout to above and if the red line crosses zero-line to above it’s a breakout to below.
The signals are generated by a crossover of the two lines so I decided to make a v2 with the difference of the two lines and I added a MA.
- Orange line same as in v1.
- Blueline is the difference between the two lines in v1.
- Crossing zeroline to below -> short, crossing to above -> long.
- And the red line is MA.
The blue line just shows the difference between price and MA20 but as you can see it shows pretty good signals no matter if one is trading the crossing of zero-line or crossing the MA and there are useful divergences too.