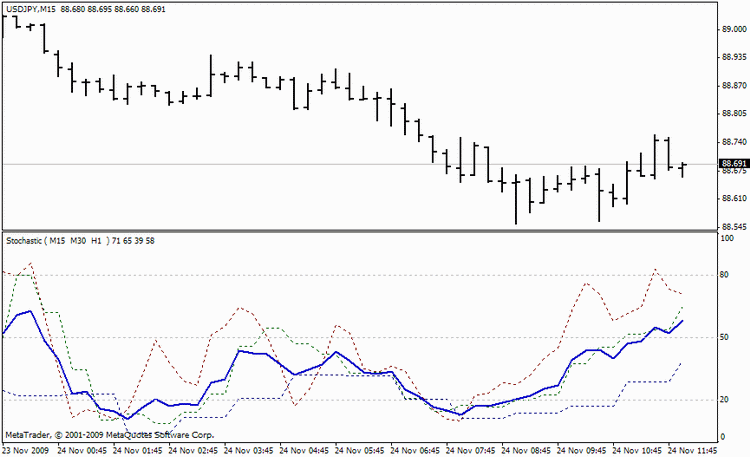
Average Stocastic indicator for several timeframes
Average Stocastic indicator for several timeframes
Buy when several stochastics are below 20, and sell when they are above 80.
It was unconvenient to change periods every time, so I have developed this indicator, maybe it can be useful.
It shows Stochastics for several timeframes in a single chart, also it calculates the average value (blue line on the chart).
