Actual Volatility Scanner
Actual Volatility Scanner
Volatility means opportunity. No price move means no profit (and no loss).
The indicator shows horizontal bars representing candle bodies with chosen index (TrackedCandleIndex).
The size of the candle body is shown in relative size to its average body (CandleAverageNumber).
The value of the relative size is shown next to the bar.
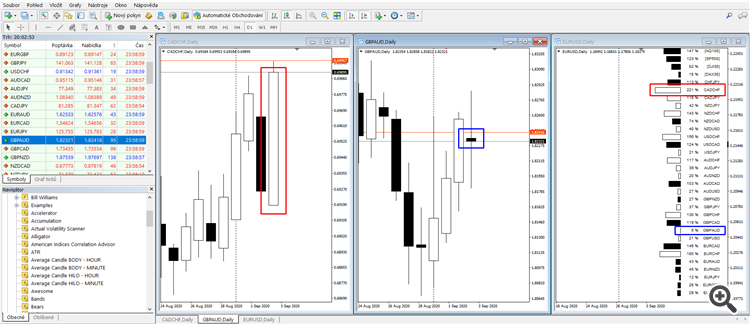
Explanation of the chart on the picture:
Value 221% means that the actual body is more than 2 times bigger than the CADCHF average body on the actual time frame. On the contrary actual body size of the pair, GBPAUD is small. Body size is only 5% of its average body means very low actual volatility on this pair.
In the indicator window you can accommodate (change) the following variables:
- TextSize,
- ReferenceBody … defines how long the bodies bars will be,
- CandleAverageNumber,
- TrackedCandleIndex … zero (0) means actual candle, one (1) means candle by one step older, and so on,
- HorizontalStartPosition … defines how far from the right the indicator will be placed.
You can place more than one instance of the indicator in one chart and get a broader picture of the price map.
In case you place another instance of the indicator for another candle index you have to accommodate variable HorizontalStartPosition to avoid the collision.
Usage:
- Actual volatility tracking: Low volatility can mean a contraction phase than bigger volatility can come. Conversely, if an extremely big candle preceded then it is less likely similarly big candle will follow.
- Correlation: On the picture above you can see a strong move of all 3 American indices one timeframe back proving the high correlation between these indices. Pairs with EUR on the contrary show very low volatility on the actual time frame, pairs with CHF show a strong move.