Acceleration&Speed Indicator
Acceleration&Speed Indicator
The idea of the indicator is very simple and obvious. Strange that similar indicators haven’t appeared yet.
Prices constantly change – go up or down. If we take N bars for a period of time, the difference of prices, for example closing prices at the ends of the period, is equal to the speed of closing price change on this period of time.
If the speed is found, the acceleration can also be found.
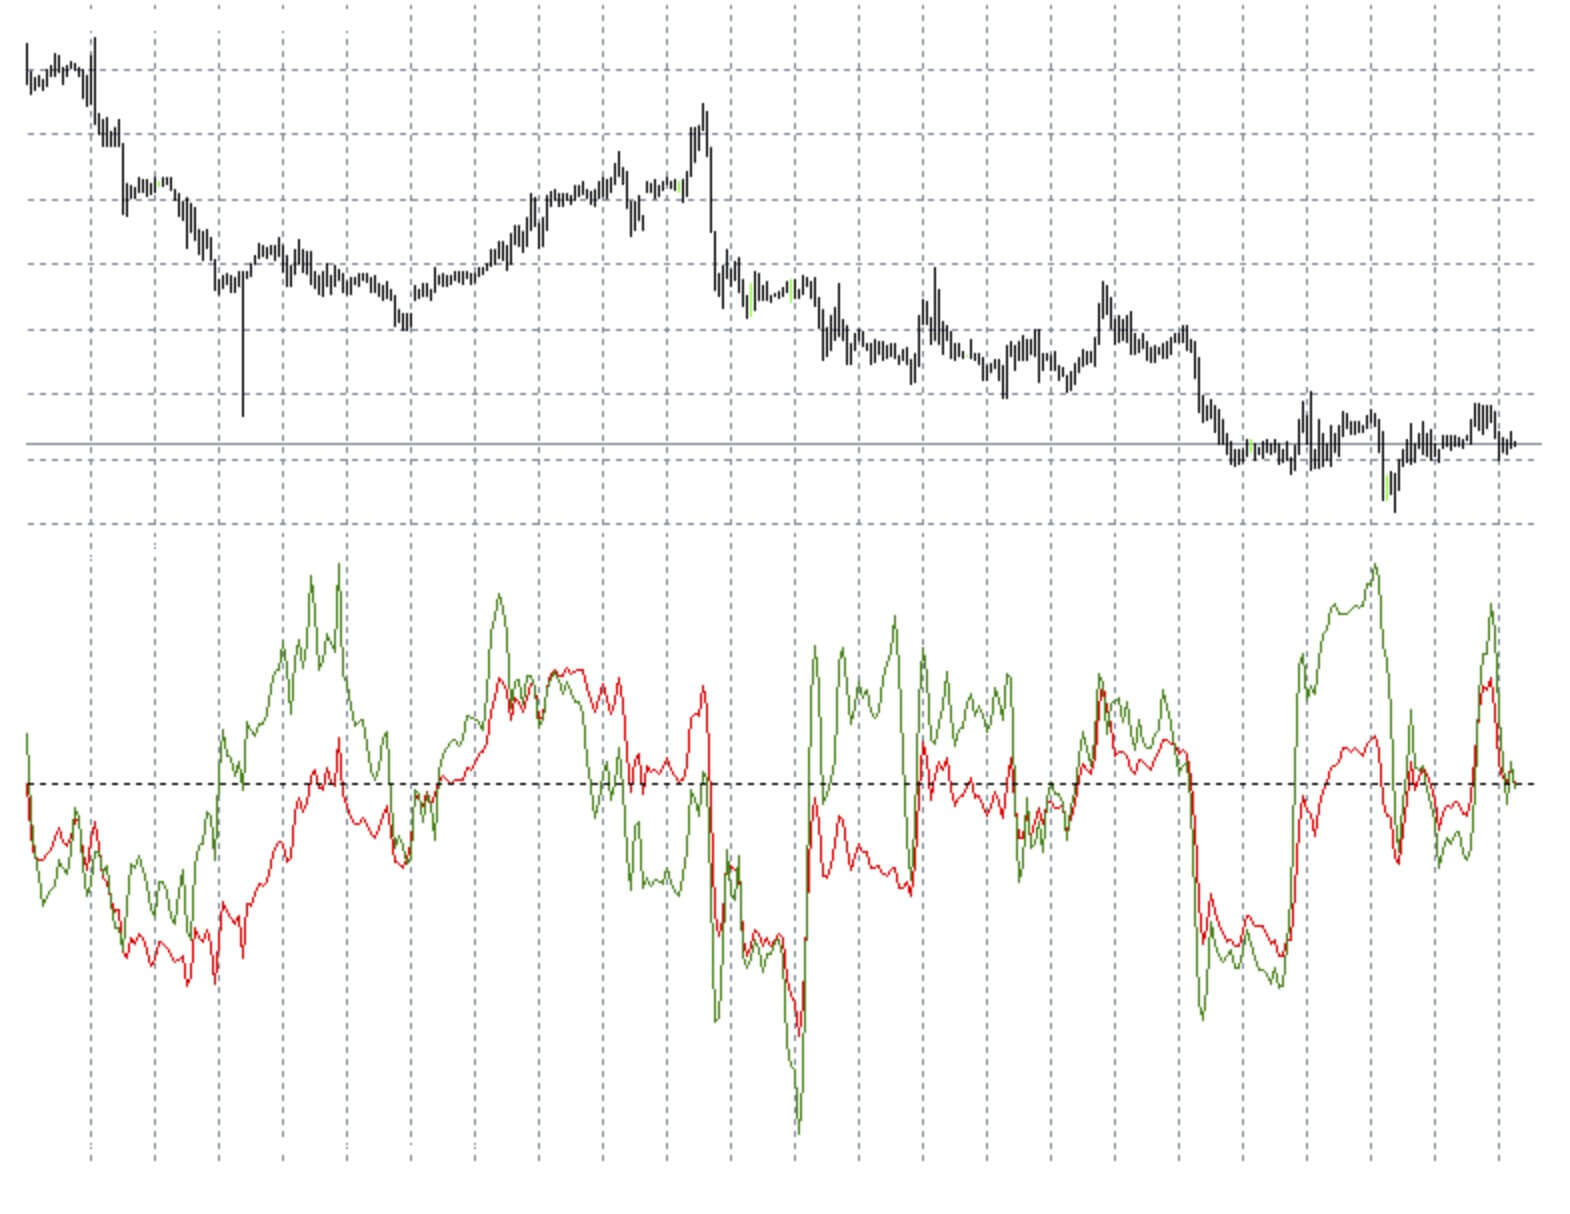
The red line is speed, the green one is acceleration. They are calculated in points.
So, what is obvious at the picture?
1. The speed has boundary values.
2. The cyclic nature.
3. The speed and the acceleration do not always have the same direction.
I have also made some changes: added speed charts (yellow) and acceleration (blue) with a shift into history; added a switcher of charts visibility.