Turn Area Chart
Turn Area Chart
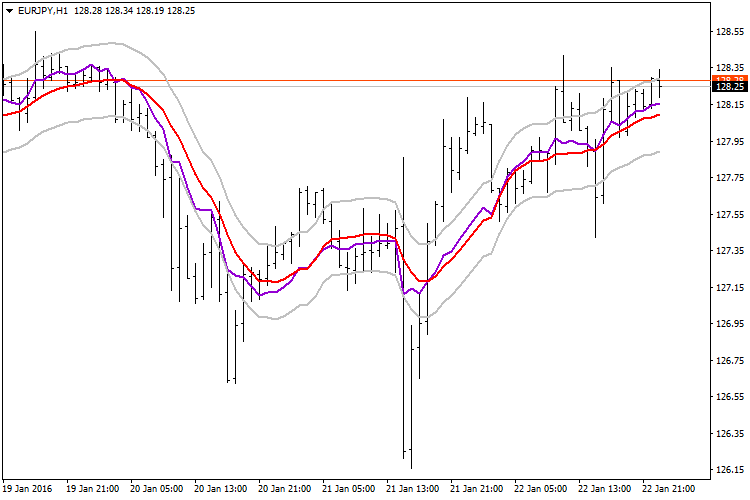
The display of the RSI indicator in the main window of the chart relative to the moving average indicator.
Description of the indicator settings:
- EMA_Period — The averaging period for the calculation of the Moving Average indicator.
- EMA_Method — SMA — simple averaging, EMA — exponential averaging, SMMA — smoothed averaging, LWMA — linearly weighted averaging.
- EMA_Price — CLOSE — close price. OPEN — open price. HIGH — High price for the period. LOW — Low price for the period. MEDIAN — median price, (high+low)/2. TYPICAL — typical price, (high+low+close)/3. WEIGHTED — weighted close price, (high+low+close+close)/4.
- RSI_Period — Averaging period for the RSI calculation.
- PSI_Price — applied price. Similar to EMA_Price.
- Level_RSI_UP — the upper level, the potential sell area.
- Level_RSI_DN — the lower level, the potential buy area.