ThreeLineBreak on Chart S/R
ThreeLineBreak on Chart S/R
Blue lines are support levels, Red ones are resistance levels.
The dashed lines are candidates.
The amount of considered lines on a breakthrough is regulated by LB parameter of the indicator.
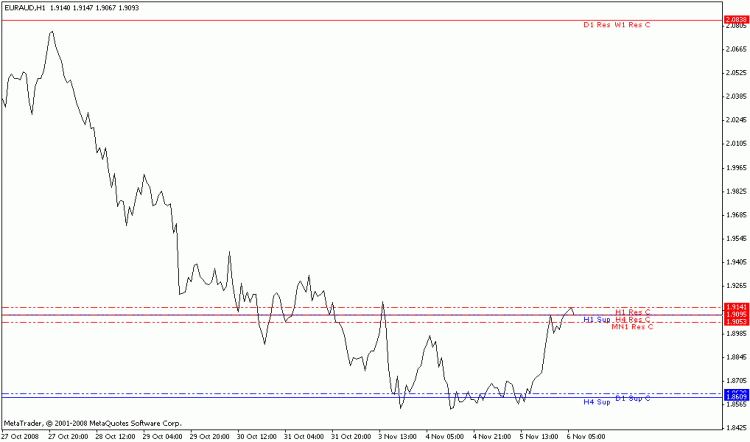
Blue lines are support levels, Red ones are resistance levels.
The dashed lines are candidates.
The amount of considered lines on a breakthrough is regulated by LB parameter of the indicator.