RSO, Relative Strength Oscillator
RSO, Relative Strength Oscillator
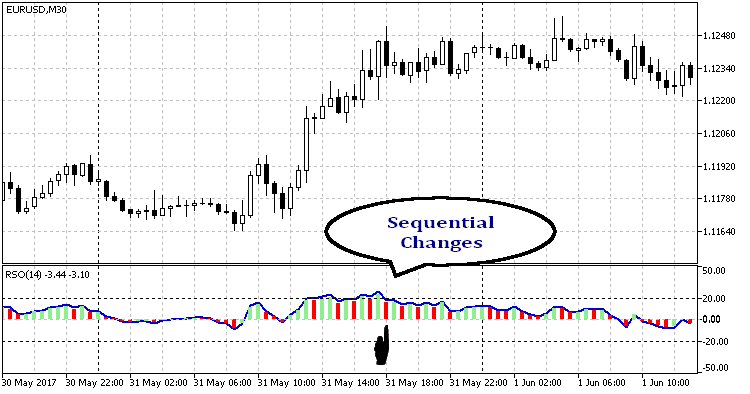
Relative Strength Oscillator or RSO is an Oscillator version of RSI. RSI as a powerful and accurate indicator is very popular. It is an index indicator and varies in the range of 0 to 100. We used to see the 70s or 30s on RSI, then decide to open a new position. But as an indicator, symmetry is more readable and more suitable for comparison. Oscillators have a centerline of usually 0.0 and swing around the centerline. RSO intends to do this role. With RSO everything is the same as before on RSI, just minus 50. Here are the 20s and -20s as overbought and oversold positions now.
I added colored bars just for more clarity. Green bars show increasing in RSO and red bars show decreasing. RSO or RSI curves cannot show little changes, while colored bars can. For example, when RSO is over 20, the first red bar reveals direction change. As you can see, RSO with bars is more comprehensible with just a glimpse.