RSI Slowdown
RSI Slowdown
The indicator is based on the idea that before the price and the indicator itself turn, the indicator rate slows down first and only then turns. As such, the areas are searched where the price begins to stagnate in the overbought or oversold zone of the fast RSI indicator.
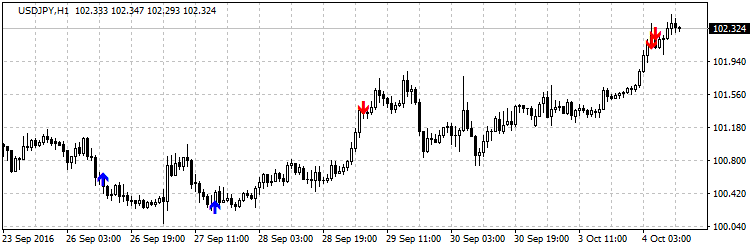
The indicator can mark these zones with both arrows and stripes on the chart (selected in the settings). It is also possible to disable the search for RSI decelerations in the settings – in this case, the indicator will show only exceeding the RSI levels specified in the settings: LevelMax and LevelMin.