RSI Peak & Bottom
RSI Peak & Bottom
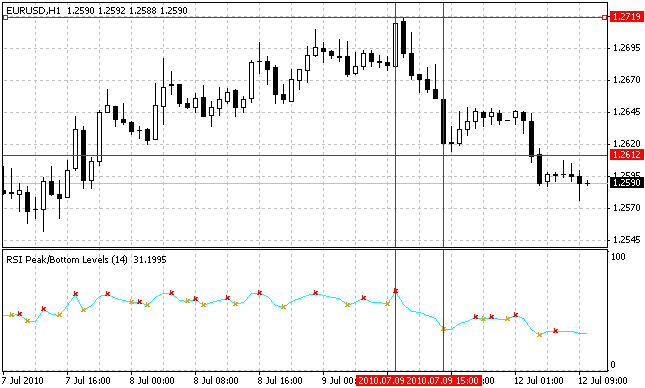
The peak/bottom could show the top level of RSI. When rsi passed the top/bottom value it indicated a buy/sell signal.
It can show the signal earlier but still need some filter, so this method could be combined with others indicator as a filter.
The red arrow is the peak and the Yellow arrow is the bottom.
I want to plot all of the peak/bottoms towards then we will get any level at the peak/bottom. and when rsi crosses the peak/bottom line, the level will be terminated 1 candle after crossing.
the calculating & plotting of others level will be continued until rsi crossing the level again.
Recommendations:
- Use This RSI levels as a Signal
- Combine with other indicators as a filter