Point & Figure Charts
Point & Figure Charts
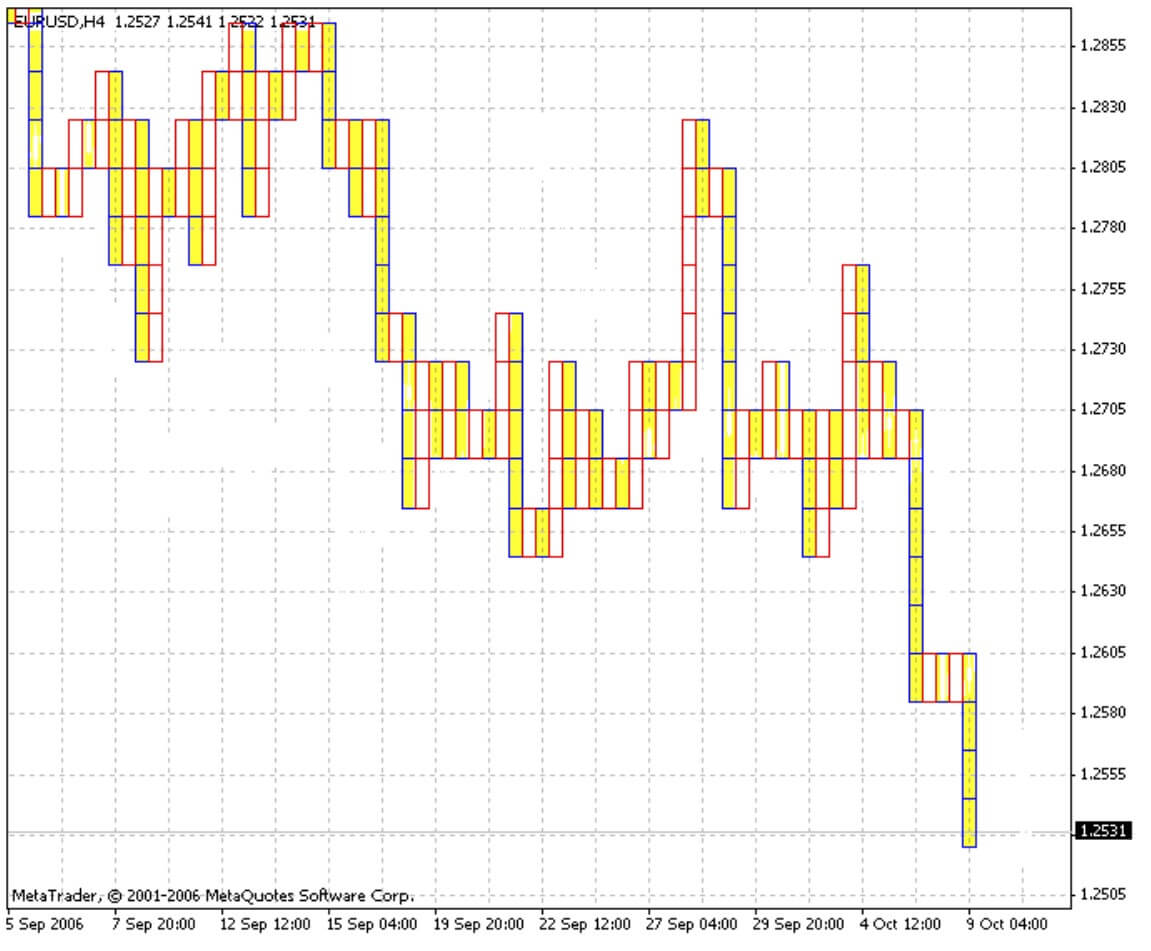
Point & Figure Charts (P&F) differ from normal price charts through that they fully ignore the time values and only show changes in prices. Instead of showing prices at Y axis and time at X axis, the P&F charts show price changes in both axes.
In these charts, “X” (the cross – the red check) is drawn when prices increase by a certain basic value (RazmBox), and “O” (the outh – the yellow check) when prices decrease by the same value. Note that neither Xs nor Os are drawn if prices have increased/decreased by a value under this certain basic value.
Every column drawn can contain either crosses or ouths, but not both elements. To switch between columns (for example, from crosses column to the ouths column), the price must change by a certain value in the opposite direction. Change of column means change of the pricing trend.
To hide price charts, it is necessary to set up the background color in the chart window properties (the “Properties” command in the chart window context menu – the “Colors” tab), in fields “Bar Up:”, “Bar Down:”, “Bull Candle:”, “Bear Candle:” and “Line”.
Parameters
RazmBox – base value.