OandaX OrderBook Chart
OandaX OrderBook Chart
The OandaX product series is designed to display additional data on orders and positions provided by the Oanda FxLabs service.
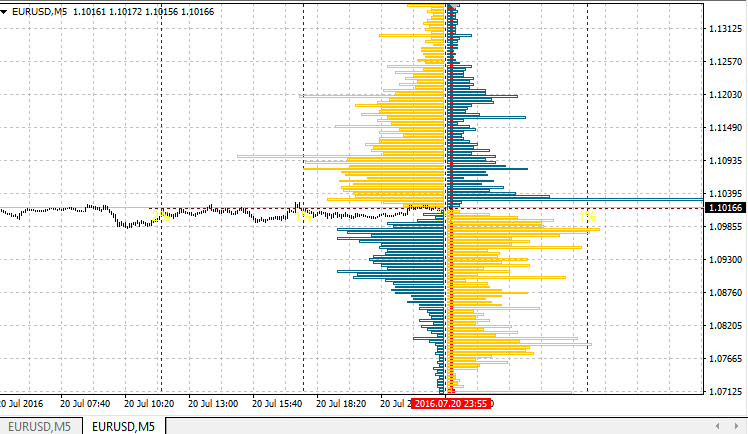
The OandaX OrderBook Chart indicator is designed to display the history histogram of orders or positions on the instrument, nearest to the time specified by the user on the chart (the vertical line is used for indication). For the constant update of data, the OandaX Download Manager EA must be running in the terminal. To display the previously downloaded data, the EA is not required.
This indicator serves as an example of calling to the data of histogram downloaded by the EA. The histogram scale is linked to the chart scale. This means that, unlike the OandaX OrderBook Image History indicator, the histogram will be drawn not at the user-defined location, but directly on the chat area, for which the data had been downloaded. The time for which the histogram is drawn will be displayed in the upper left corner (using the Comment function).
If the vertical indication line is located at the 0 bar or to the right from it (at the location of upcoming history), the line will be automatically moved to the right when a new bar appears. This is done to be able to constantly monitor the latest data downloaded.
- The order book (OrderBook) or Open Orders. This is a histogram that shows the distribution of limits and stops orders by price levels. The limit orders include the Buy Limit orders and the Take Profit levels. The stop orders include the Sell Limit orders and the Stop Loss levels.
- Position book or Open Positions. This histogram shows the distribution of prices, at which the active positions of traders were opened at the time the histogram was formed.
The above information is available for 16 instruments: AUDJPY, AUDUSD, EURAUD, EURCHF, EURGBP, EURJPY, EURUSD, GBPCHF, GBPJPY, GBPUSD, NZDUSD, USDCAD, USDCHF, USDJPY, XAUUSD, XAGUSD.
The minimum step of history data is 20 minutes, but depending on the history depth the step can increase up to 24 hours, there can also be unexpected gaps.
Four display formats are available for both (orders and positions) histograms:
- basic; displays a basic level histogram without further processing
- cumulative; the values of all the previous levels are added to each level
- simple difference; instead of short and long orders (positions), their difference is displayed
- cumulative difference; the difference for the cumulative histogram
The data is downloaded and saved by UTC time, therefore, for the correct display of the histogram time, set the correct time zone of your broker server relative to UTC in the indicator settings
Indicator parameters
- Use Custom Instrument — True, if you have non-standard instrument names or if you need to display a histogram of another instrument on the chart;
- Custom Instrument Name — instrument name in the format of Oanda FxLabs. For EURUSD — EUR_USD, for Gold, XAUUSD — XAU_USD, for Silver, XAGUSD — XAG_USD;
- Server UTC Time Offset — time zone of your server relative to UTC
- Show Histogram Cumulative — if True, draws cumulative histogram, i.e. the values of previous levels are added to each subsequent level;
- Show Histogram Difference — if True, displays difference horizontal, i.e. displays not buy or sell levels for the horizontal level, but their difference. Also works for the cumulative mode.
- Show Orders (Positions if False) — if True, displays a histogram of orders, if False, displays a histogram of positions, i.e. level distribution of the prices the current positions were opened at.