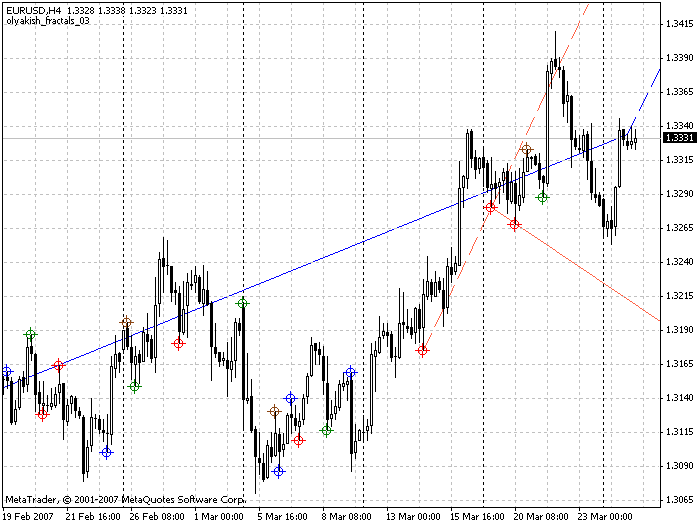
New_Fractal_Lines
New_Fractal_Lines
After reading the first “Chaos” by B. Williams I came up with the idea to implement not the “squat” bar, but the “squat” fractal. The idea: take the two nearby divergent fractals. Let the first (further in history) is downwards, the second (closer in history) is upwards. Calculate the delta of the fractal:
(High[i+2] – Low[i+2] + High[i+1] – Low[i+1] + High[i] – Low[i] + High[i-1] – Low[i-1] + High[i-2] – Low[i-2]);
Calculate the total (tick) volume of the fractal:
(Volume[i+2] + Volume[i+1] + Volume[i] + Volume[i-1] + Volume[i-2]);
Calculate the MFI of the fractal:
(delta / total volume);
The same is done with the second fractal. Next, if
(MFI1 > MFI2 && Vol1 < Vol2) == true;then draw a dot above the High of this fractal. The resistance line is the trend line plotted across two adjacent upward “squat” fractals. Almost the same is with a pair of fractals in different directions: first up, second down. The only difference is that the dot is drawn lower than the Low below the downward “squat” fractal. The resistance line is the trend line plotted across two adjacent downward “squat” fractals.
The trading system using this indicator is not fully developed, but I think:
– If the support line (brown) is directed upward and the price is above it, wait for the price to close below this line and sell;
– If the support line (brown) is directed downward and the price breaks (closes) above it, then do not enter the trade.
Exactly the opposite is true for trading the support line breakouts. But this is not the final version.
Feel free to comment on the improvement of both the indicator and the trading system based on it.
