MTF EMA 20
MTF EMA 20
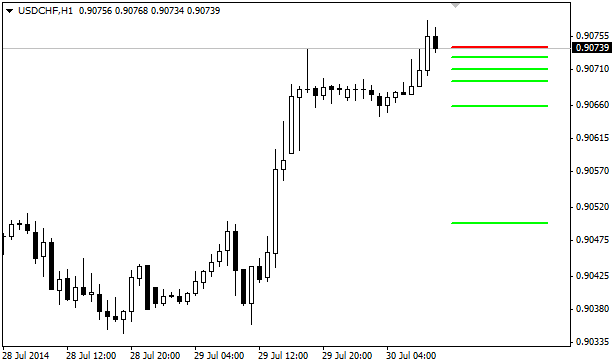
This indicator helps to find possible support/resistance areas after a trend has developed (normally first pullback ends at EMA’s region).
It shows the value for EMA 20 from M1 to MN1 timeframes.
This indicator helps to find possible support/resistance areas after a trend has developed (normally first pullback ends at EMA’s region).
It shows the value for EMA 20 from M1 to MN1 timeframes.