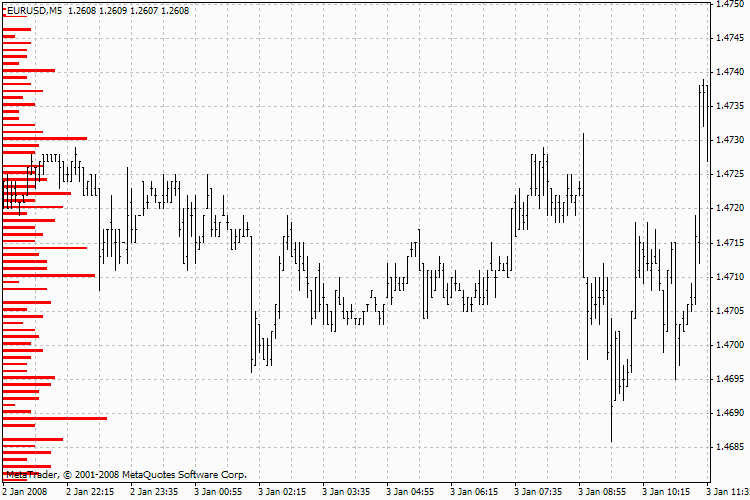
Hystogram of levels
Hystogram of levels
The indicator calculates the number of the local maximums (by High) and minimums (by Low) of the price that fall within every value of the price in all available history of the symbol. The result is displayed in the form of a hystogram located to the left of the chart in the chart window. To reduce the noise, the levels of max. and min. are fixed only after they are confirmed by the corresponding max. and min. of the supporting moving average.
