HP Extrapolator
HP Extrapolator
The distinctive feature of the Hodrick-Prescott filter is that it does not delay. It is calculated by minimizing the objective function
F = Sum((y[i] – x[i])^2,i=0..n-1) + lambda*Sum((y[i+1]+y[i-1]-2*y[i])^2,i=1..n-2)
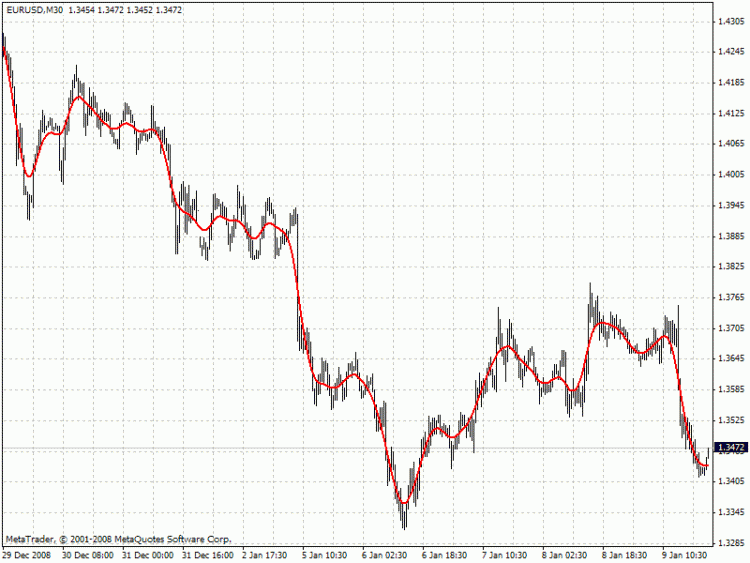
where x[] – prices, y[] – filter values. Below is the example of the filter behavior (see the file HP.mq4 attached below)
If the Hodrick-Prescott filter sees the future, then what future values does it suggest? To answer this question, we should find the digital low-frequency filter with the frequency parameter similar to the Hodrick-Prescott filter’s one but with the values calculated directly using the past values of the “twin filter” itself, i.e.
y[i] = Sum(a[k]*x[i-k],k=0..nx-1) – FIR filter
or
y[i] = Sum(a[k]*x[i-k],k=0..nx-1) + Sum(b[k]*y[i-k],k=1..ny) – IIR filter
It is better to select the “twin filter” having the frequency-independent delay Тdel (constant group delay). IIR filters are not suitable. For FIR filters, the condition for a frequency-independent delay is as follows:
a[i] = +/-a[nx-1-i], i = 0..nx-1
The simplest FIR filter with constant delay is Simple Moving Average (SMA):
y[i] = Sum(x[i-k],k=0..nx-1)/nx
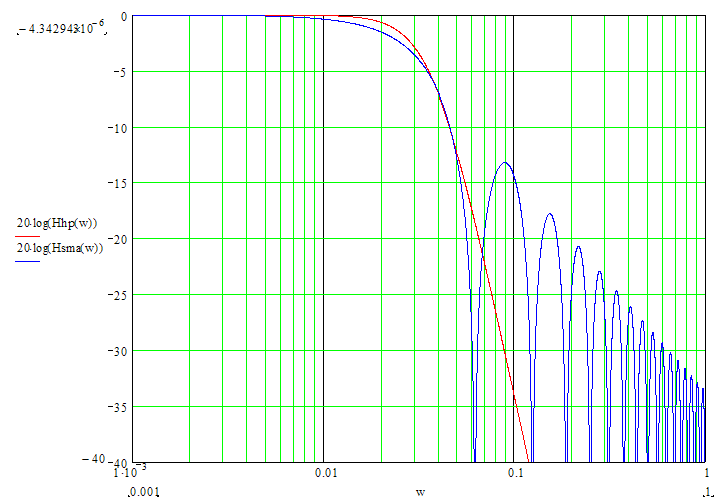
In case nx is an odd number, Тdel = (nx-1)/2. If we shift the values of SMA filter to the past by the amount of bars equal to Тdel, SMA values coincide with the Hodrick-Prescott filter ones. The exact math cannot be achieved due to the significant differences in the frequency parameters of the two filters (see the chart below):
To achieve the closest match between the filter values, I recommend their channel widths to be similar (for example, -6dB). The Hodrick-Prescott filter’s channel width of -6dB is calculated as follows:
wc = 2*arcsin(0.5/lambda^0.25).
The channel width of -6dB for the SMA filter is calculated by numerical computing via the following equation:
|H(w)| = sin(nx*wc/2)/sin(wc/2)/nx = 0.5
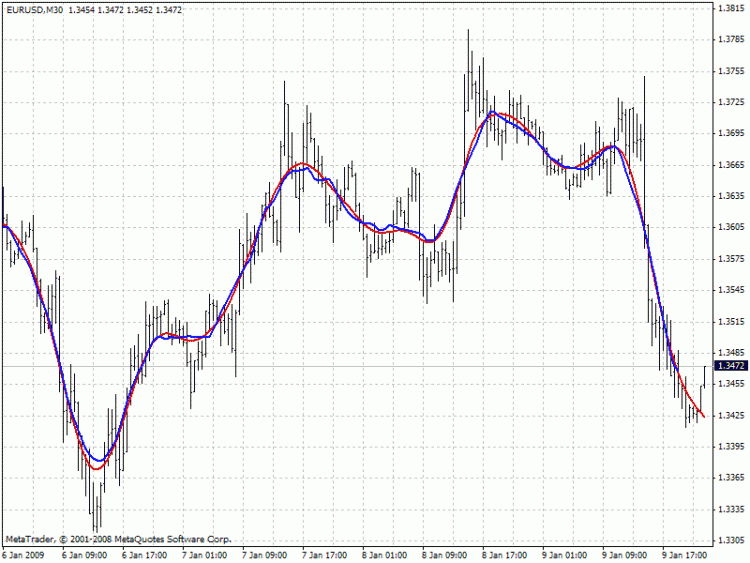
The chart below compares the values of the two filters having the similar channel width: red – Hodrick-Prescott filter (FiltPer = 25), blue – SMA (Period = 15, Shift = -7). Note that there is no SMA data for the last 7 bars since it needs to know future prices. Oppositely, the Hodrick-Prescott filter (red) shows some values. If the shifted SMA repeats the values of the Hodrick-Prescott filter on the last 7 bars after the future prices appear, then what can these values be?
Prediction algorithms:
The indicator features the two prediction methods:
Metod 1:
1. Set SMA length to 3 and shift it to the past by 1 bar. With such a length, the shifted SMA does not exist only for the last bar (Bar = 0), since it needs the value of the next future price Close[-1].
2. Calculate SMA filer’s channel width. Equal it to the Hodrick-Prescott filter’s one. Find lambda.
3. Calculate Hodrick-Prescott filter value at the last bar HP[0] and assume that SMA[0] with unknown Close[-1] gives the same value.
4. Find Close[-1] = 3*HP[0] – Close[0] – Close[1]
5. Increase the length of SMA to 5. Repeat all calculations and find Close[-2] = 5*HP[0] – Close[-1] – Close[0] – Close[1] – Close[2]. Continue till the specified amount of future FutBars prices is calculated.
Method 2:
1. Set SMA length equal to 2*FutBars+1 and shift SMA to the past by FutBars
2. Calculate SMA filer’s channel width. Equal it to the Hodrick-Prescott filter’s one. Find lambda.
3. Calculate Hodrick-Prescott filter values at the last FutBars and assume that SMA behaves similarly when new prices appear.
4. Find Close[-1] = (2*FutBars+1)*HP[FutBars-1] – Sum(Close[i],i=0..2*FutBars-1), Close[-2] = (2*FutBars+1)*HP[FutBars-2] – Sum(Close[i],i=-1..2*FutBars-2), etc.
The indicator features the following inputs:
Method – prediction method
LastBar – number of the last bar to check predictions on the existing prices (LastBar >= 0)
PastBars – amount of previous bars the Hodrick-Prescott filter is calculated for (the more, the better, or at least PastBars>2*FutBars)
FutBars – amount of predicted future values
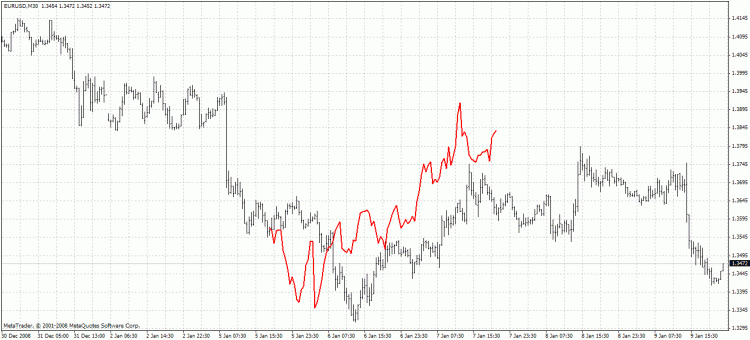
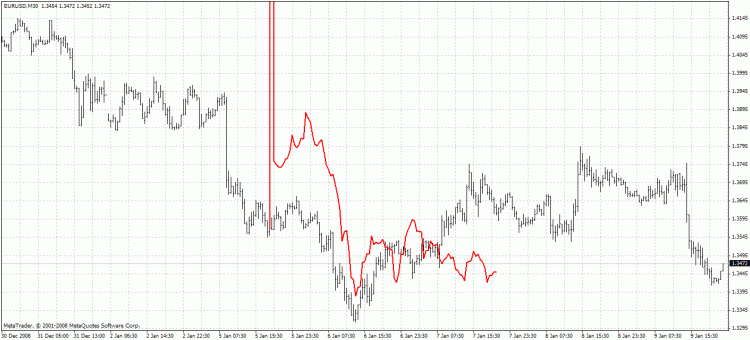
The indicator highlights predicted values in red. Method 1 is used in the example below:
Method 2:
The second method is more accurate but often has large spikes of the first predicted price. The described prediction method can be improved by searching for the FIR filter with the frequency parameter closer to the Hodrick-Prescott filter. For example, you may try Hanning, Blackman, Kaiser, and other filters with constant delay instead of SMA.
